Monitor & Visualize
Install Grafana and Prometheus
Istio provides a basic sample installation to quickly get Prometheus and Grafana up and running, bundled with all of the Istio dashboards already installed:
export ISTIO_RELEASE=$(echo $ISTIO_VERSION |cut -d. -f1,2)

# Install Prometheus
kubectl apply -f https://raw.githubusercontent.com/istio/istio/release-${ISTIO_RELEASE}/samples/addons/prometheus.yaml

# Install Grafana
kubectl apply -f https://raw.githubusercontent.com/istio/istio/release-${ISTIO_RELEASE}/samples/addons/grafana.yaml
We can now verify that they have been installed:
kubectl -n istio-system get deploy grafana prometheus
Install Jaeger and Kiali
Jaeger is an open source end to end distributed tracing system, allowing users to monitor and troubleshoot complex distributed systems. Jaeger addresses issues with distributed transaction monitoring, performance and latency optimization, root cause and service dependency analysis etc.
kubectl apply -f https://raw.githubusercontent.com/istio/istio/release-${ISTIO_RELEASE}/samples/addons/jaeger.yaml
Kiali is a management console for an Istio-based service mesh. It provides dashboards, observability, and lets you operate your mesh with robust configuration and validation capabilities. It shows the structure of your service mesh by inferring traffic topology and displays the health of your mesh. Kiali provides detailed metrics, powerful validation, Grafana access, and strong integration for distributed tracing with Jaeger. You may visit official site to view features it offers.
kubectl apply -f https://raw.githubusercontent.com/istio/istio/release-${ISTIO_RELEASE}/samples/addons/kiali.yaml
We can now verify that they have been installed:
kubectl -n istio-system get deploy jaeger kiali
Generate traffic to collect telemetry data
Open a new terminal tab and use these commands to send a traffic to the mesh
export GATEWAY_URL=$(kubectl -n istio-system get service istio-ingressgateway -o jsonpath='{.status.loadBalancer.ingress[0].hostname}')

watch --interval 1 curl -s -I -XGET "http://${GATEWAY_URL}/productpage"
Next, we will launch Kiali to visualize application tracing and metrics.
Launch Kiali
Open a new terminal tab and launch kiali dashboard by executing the following command
kubectl -n istio-system port-forward \
$(kubectl -n istio-system get pod -l app=kiali -o jsonpath='{.items[0].metadata.name}') 8080:20001
Open Kiali dashboard. Click Preview / Preview Running Application in Cloud9 environment.

Click the ‘Pop Out Into New Window’ button

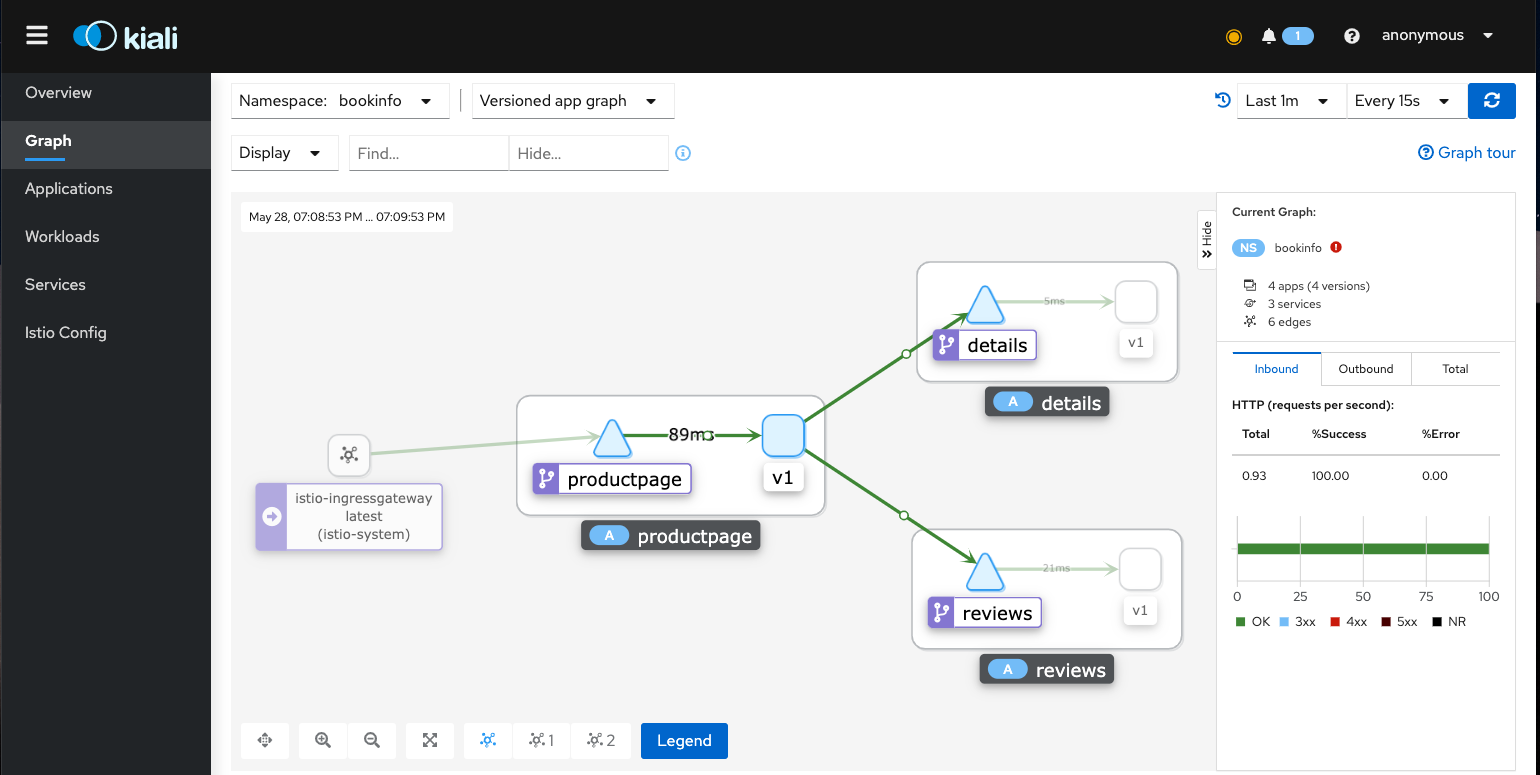
Navigate to Graph from left panel to view graphical view of application

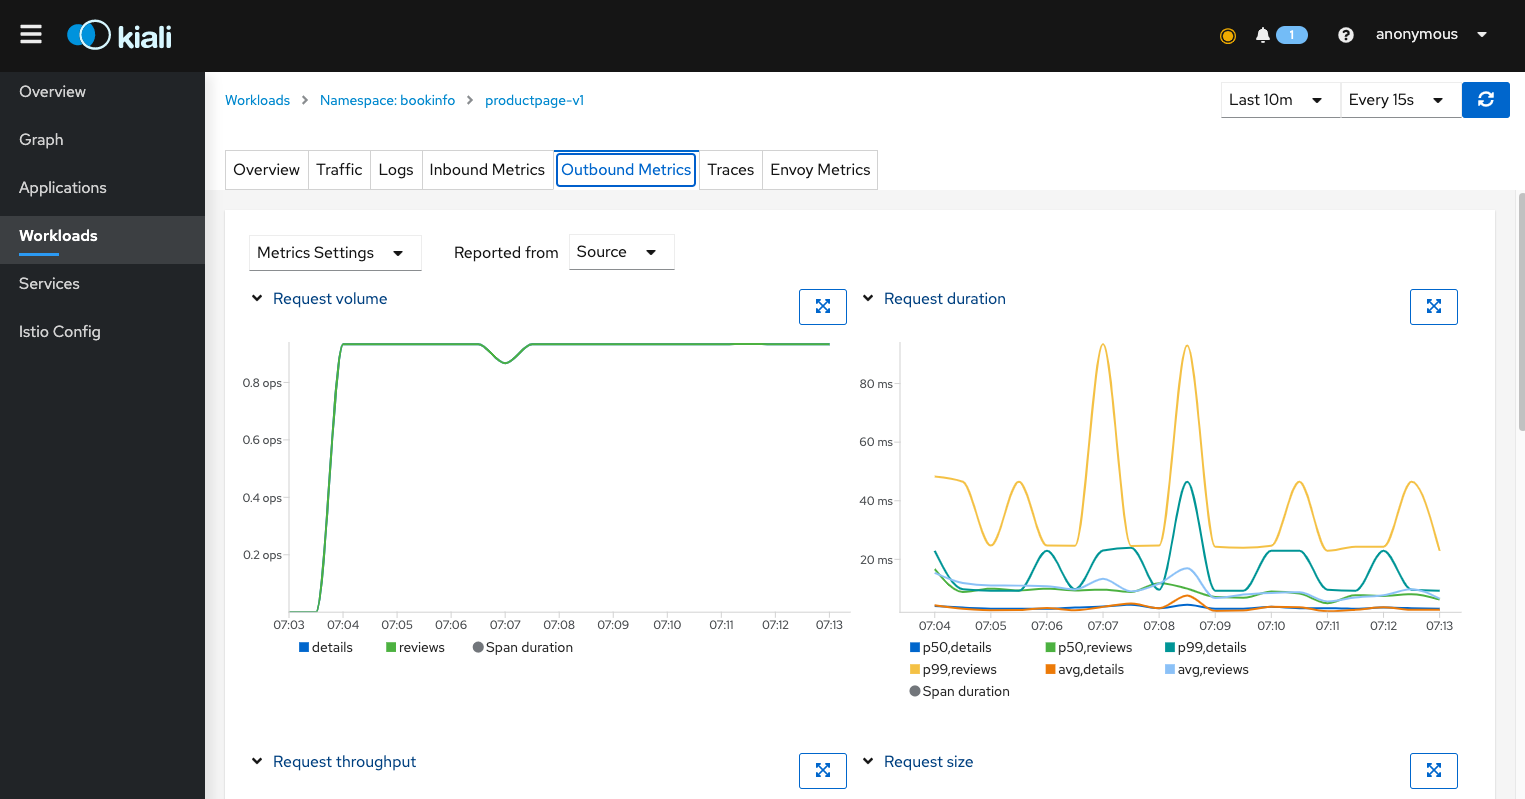
Navigate Kiali interface to see powerful tracing and monitoring features

Launch Grafana Dashboard
Currently Cloud9 IDE does not support previewing multiple running applications. Stop Kiali listener before launching Grafana.
Next, we will visualize application metrics using Grafana. Open a new terminal tab and setup port-forwarding for Grafana by executing the following command
kubectl -n istio-system port-forward $(kubectl -n istio-system get pod -l app=grafana -o jsonpath='{.items[0].metadata.name}') 8080:3000
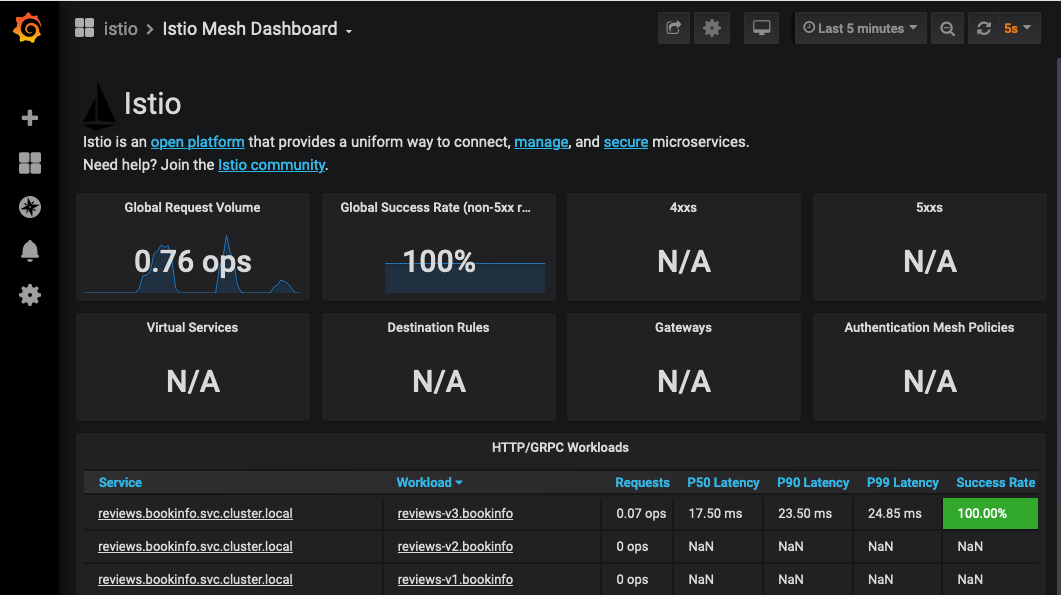
Open the Istio Dashboard via the Grafana UI
- In your Cloud9 environment, click Preview / Preview Running Application

- Scroll to the end of the URL and append:
dashboard/db/istio-mesh-dashboard
- Click the ‘Pop Out Into New Window’ button

You will see that the traffic is evenly spread between reviews:v1 and reviews:v3

We encourage you to explore other Istio dashboards that are available by clicking the Istio Mesh Dashboard menu on top left of the page, and selecting a different dashboard.