Query Metrics
Configure AMP data source
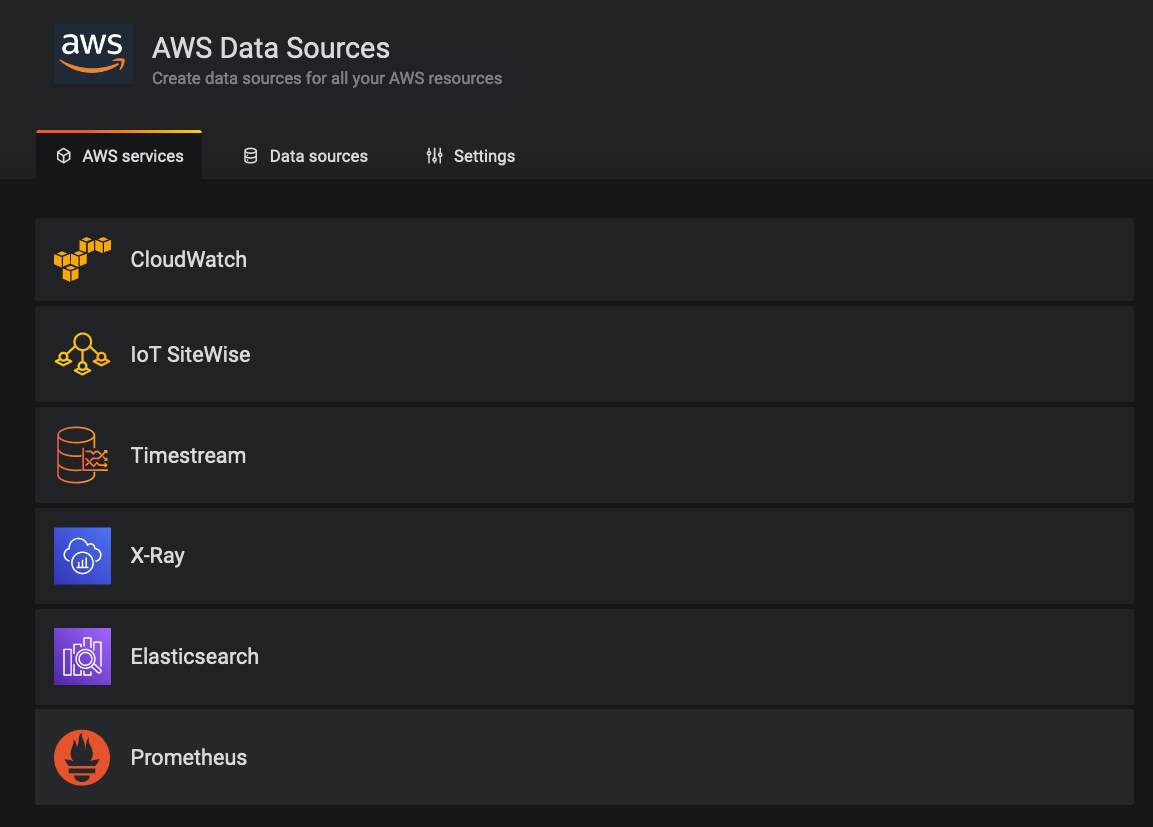
Select AWS services from the AWS logo on the left navigation bar, which will take you to the screen as shown below showing all the AWS data sources available for you to choose from.
Select Prometheus from the list, select the AWS Region where you created the AMP workspace. This will automatically populate the AMP workspaces available in that Region as shown below.
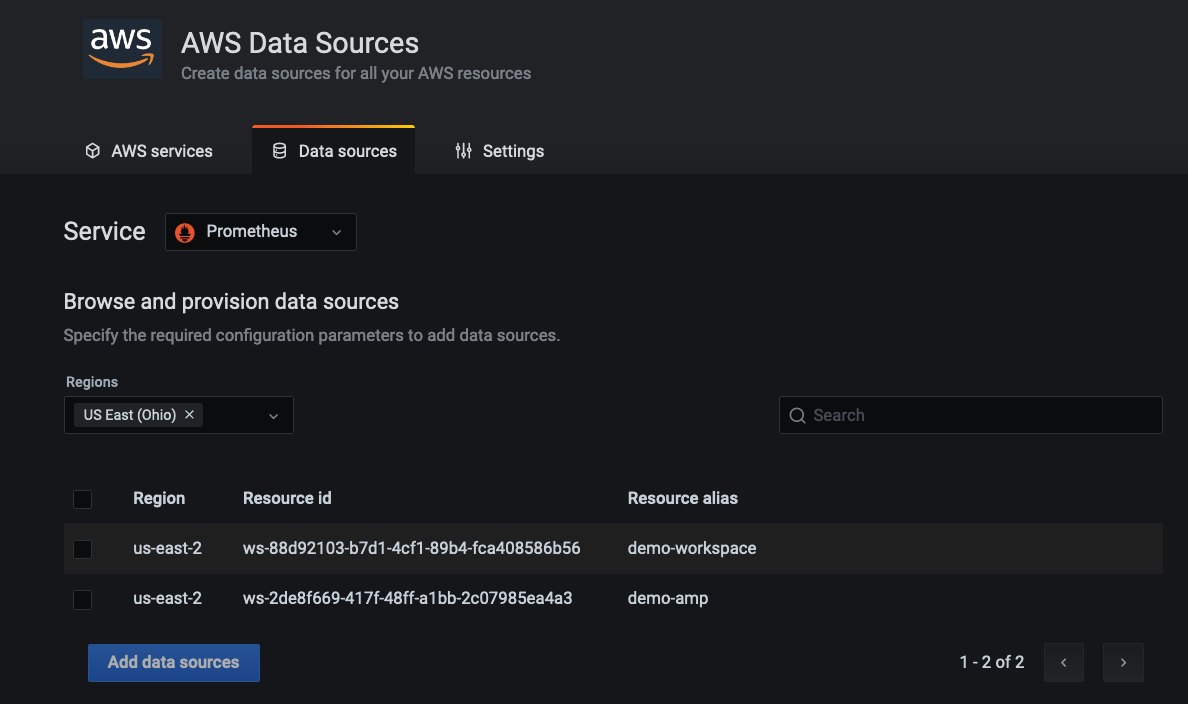
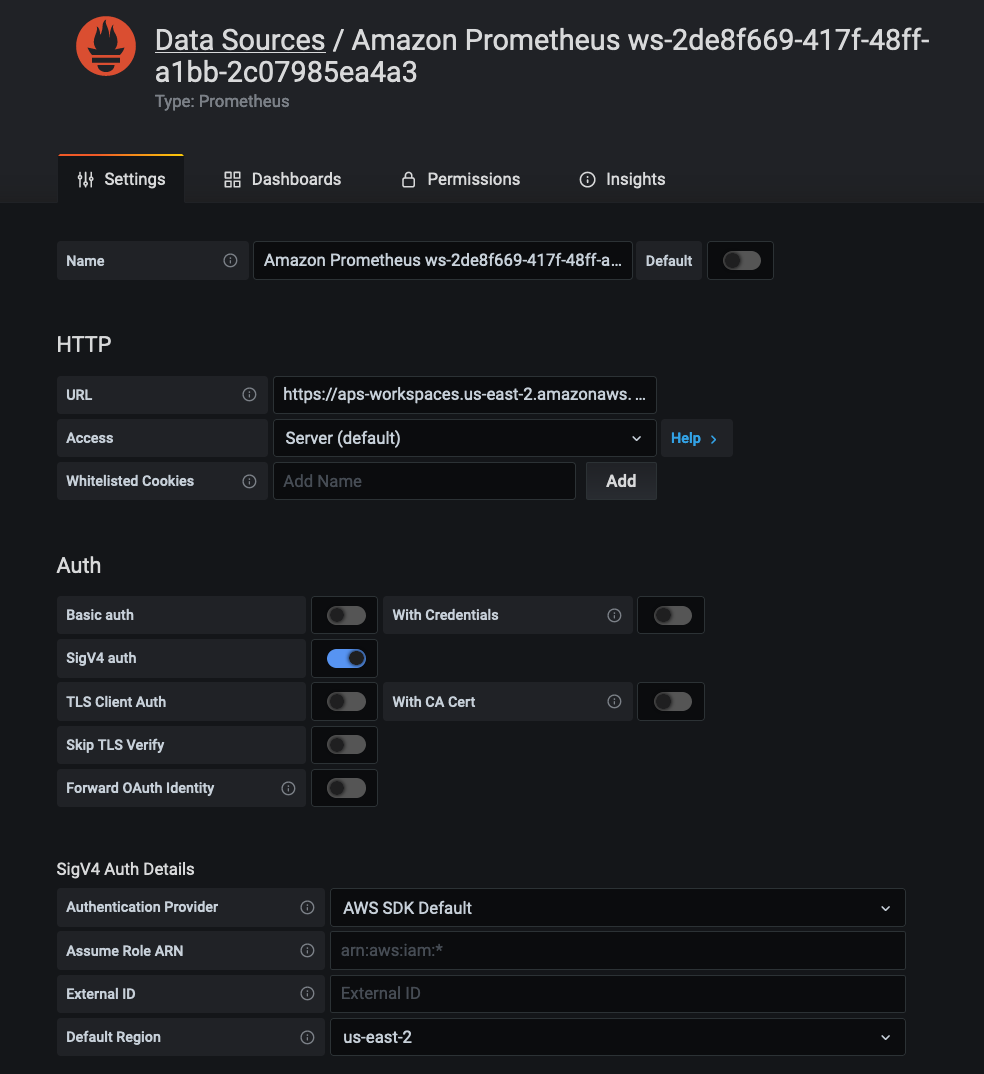
Simply select the AMP workspace from the list and click Add data sources. Once added you will able to see that the AMP data source is authenticated through SigV4 protocol. Grafana (7.3.5 and above) has the AWS SigV4 proxy built-in as a plugin which makes this possible.
Query Metrics
In this section we will be importing a public Grafana dashboard that allows us to visualize metrics from a Kubernetes environment.
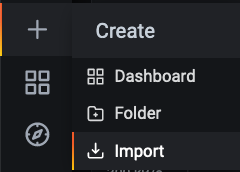
Go to the plus sign on the left navigation bar and select Import.
In the Import screen, type 3119 in Import via grafana.com textbox and click Load
Select the AMP data source in the drop down at the bottom and click on Import

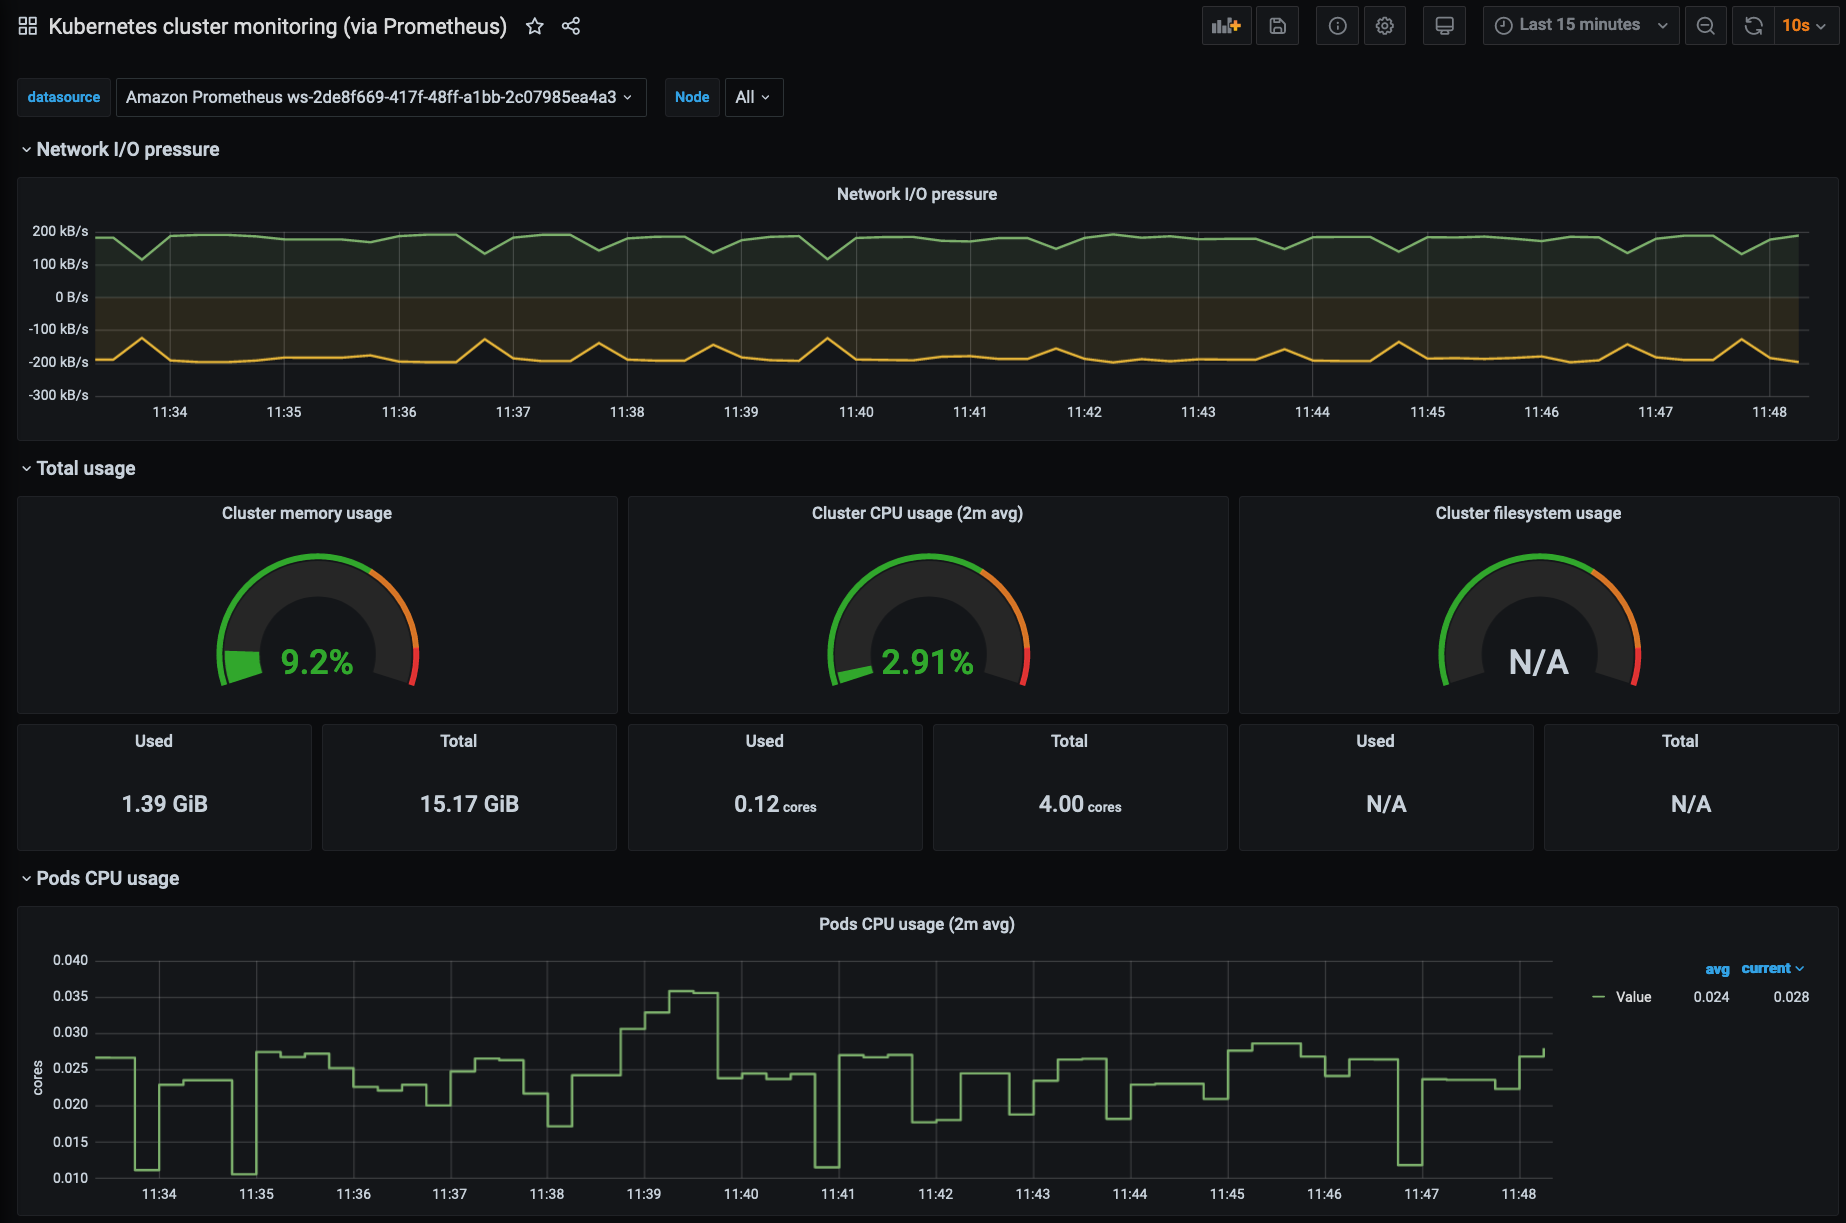
Once complete, you will be able to see the Grafana dashboard showing metrics from the EKS cluster through AMP data source as shown below.
You can also create your own custom dashboard using PromQL by creating a custom dashboard and adding a panel connecting AMP as the data source.