Receiver
Deploying the Prometheus Metrics Scraper
Let’s deploy a single OpenTelemetry Collector which scrapes prometheus metrics from the EKS Control Plane and sends them to CloudWatch.
First let’s create a temporary environment variable place holder.
export WORKSPACE_ID='${WORKSPACE_ID}'
Now we’ll update the manifest for this Prometheus metric scraper with our environment variables, and deploy the singleton collector.
envsubst < kubernetes/adot/otel-prometheus.yaml | sponge kubernetes/adot/otel-prometheus.yaml
kubectl apply -f kubernetes/adot/otel-prometheus.yaml
Let’s check that the scraper is deployed and running. Wait until READY shows 1/1.
kubectl get pods -n aws-otel-eks -l name=aws-otel-eks-prometheus
Viewing Kubernetes Metrics in CloudWatch
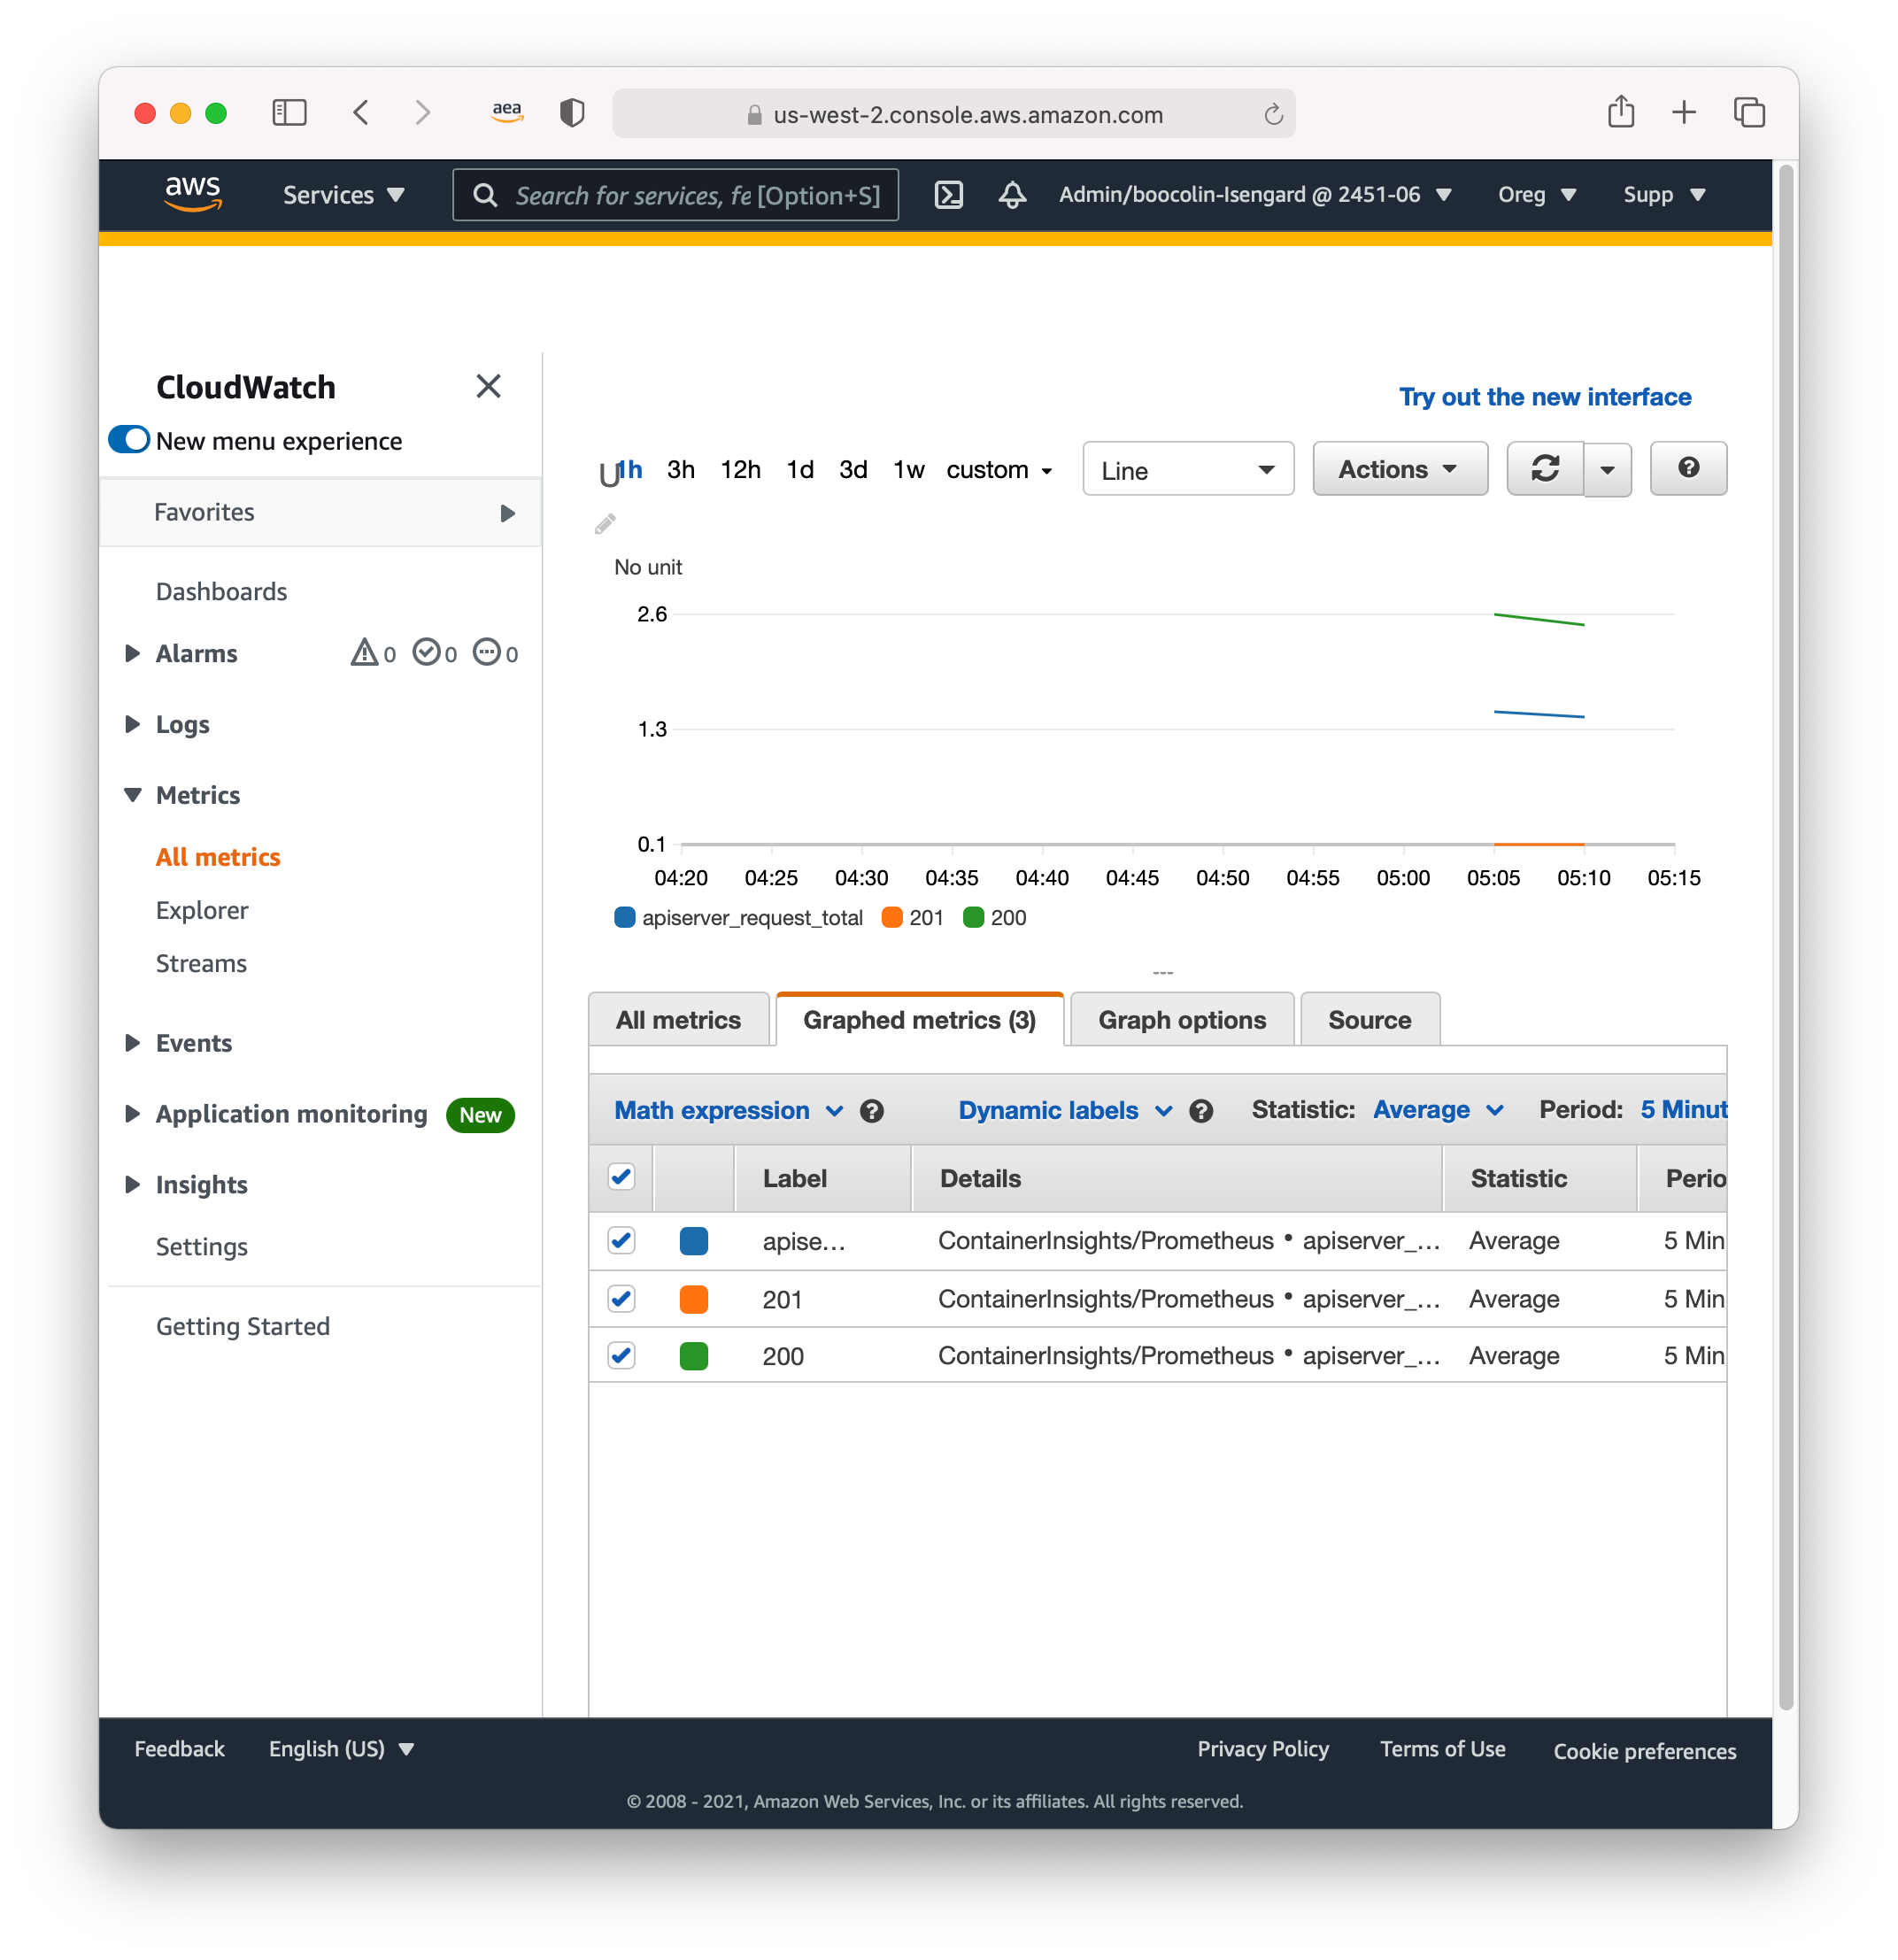
The Prometheus collector is now deployed, let’s open the CloudWatch console to see the metrics pulled in. A direct link to the CloudWatch console can be generated with this command:
echo -e "https://${AWS_REGION}.console.aws.amazon.com/cloudwatch/home?region=${AWS_REGION}"
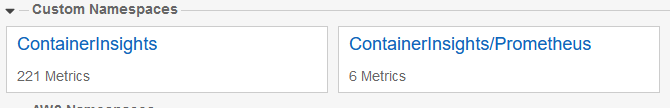
Open the URL, and head to Metrics > All Metrics. You will see a namespace of ContainerInsights/Prometheus,
which contains the scraped Kubernetes Metrics.
It can take a few minutes before you start seeing the Kubernetes metrics in CloudWatch.