Viewing Traces in X-Ray & CloudWatch
X-Ray
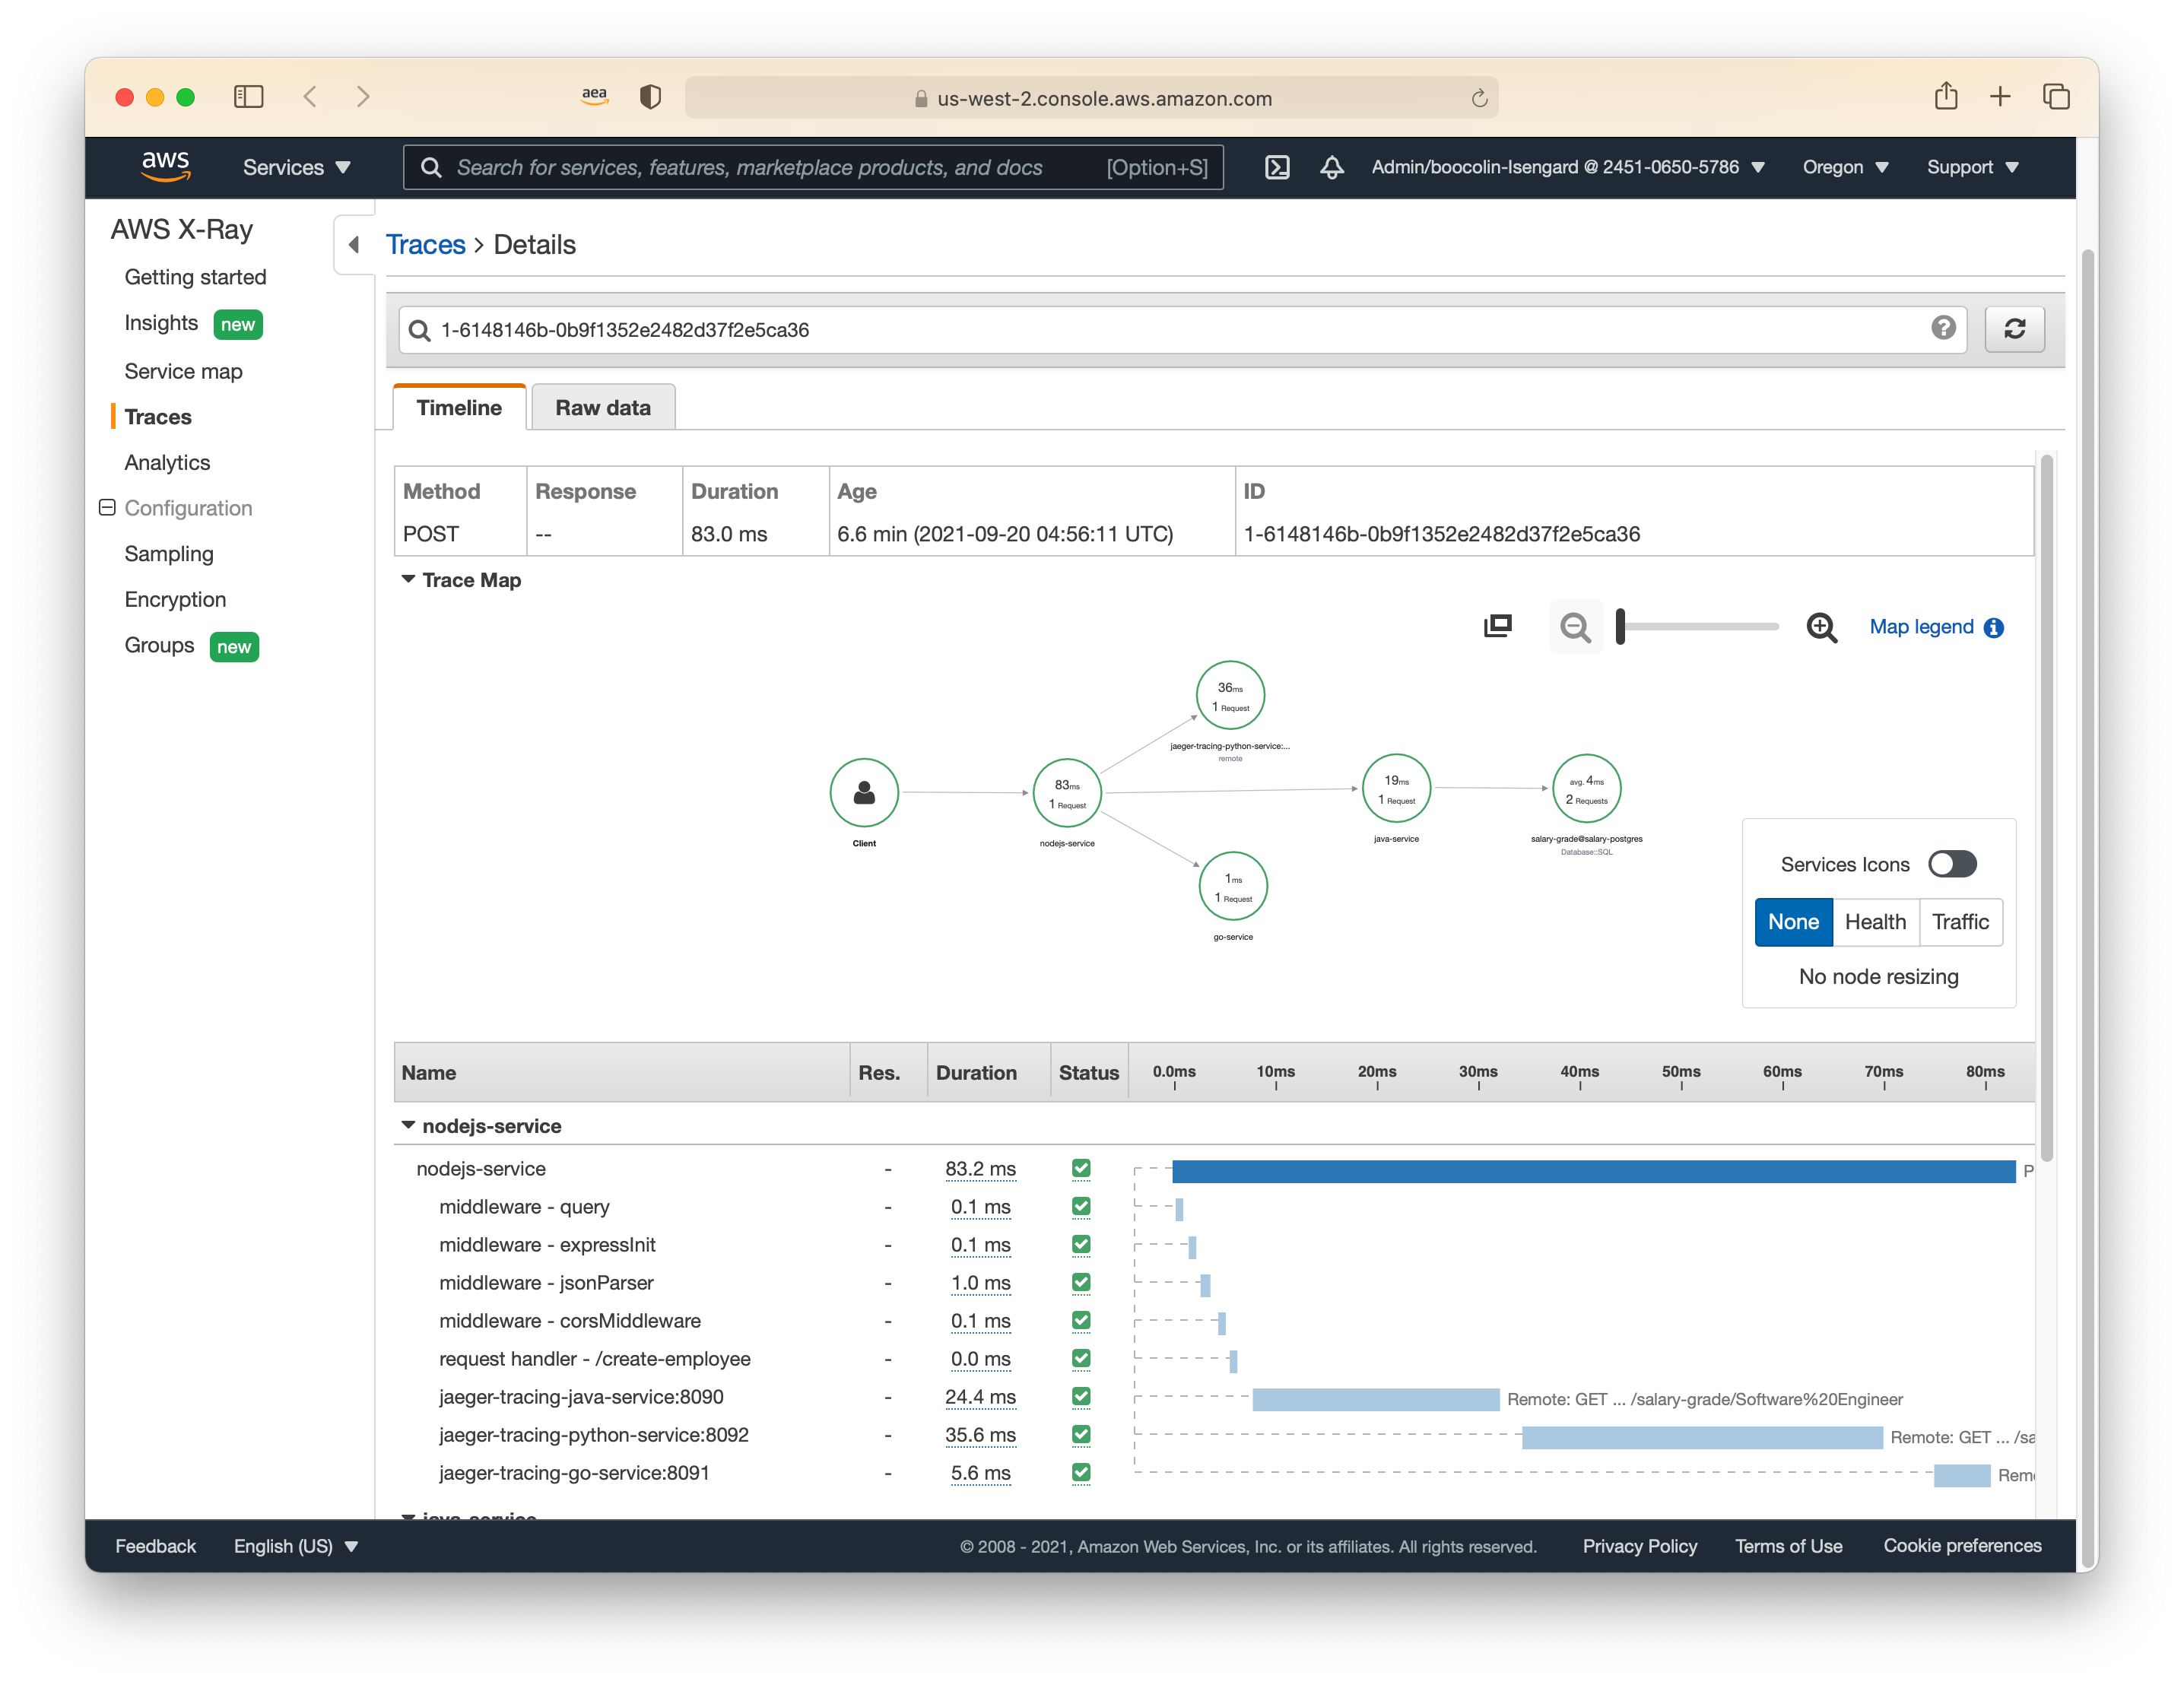
Now let’s head to the AWS X-Ray console and open the Service Map menu. We can get the URL for X-Ray Service Map by running the following command:
echo "https://${AWS_REGION}.console.aws.amazon.com/xray/home?region=${AWS_REGION}#/service-map"
Selecting Trace on the left-hand menu in the AWS X-Ray console, we can view traces the Collector received and exported to X-Ray for our Create Employee API Call.
Note, X-Ray by default is set to show traces from the Last 5 minutes, if the Employee was created more than 5 minutes ago, increase the window-size (top right).
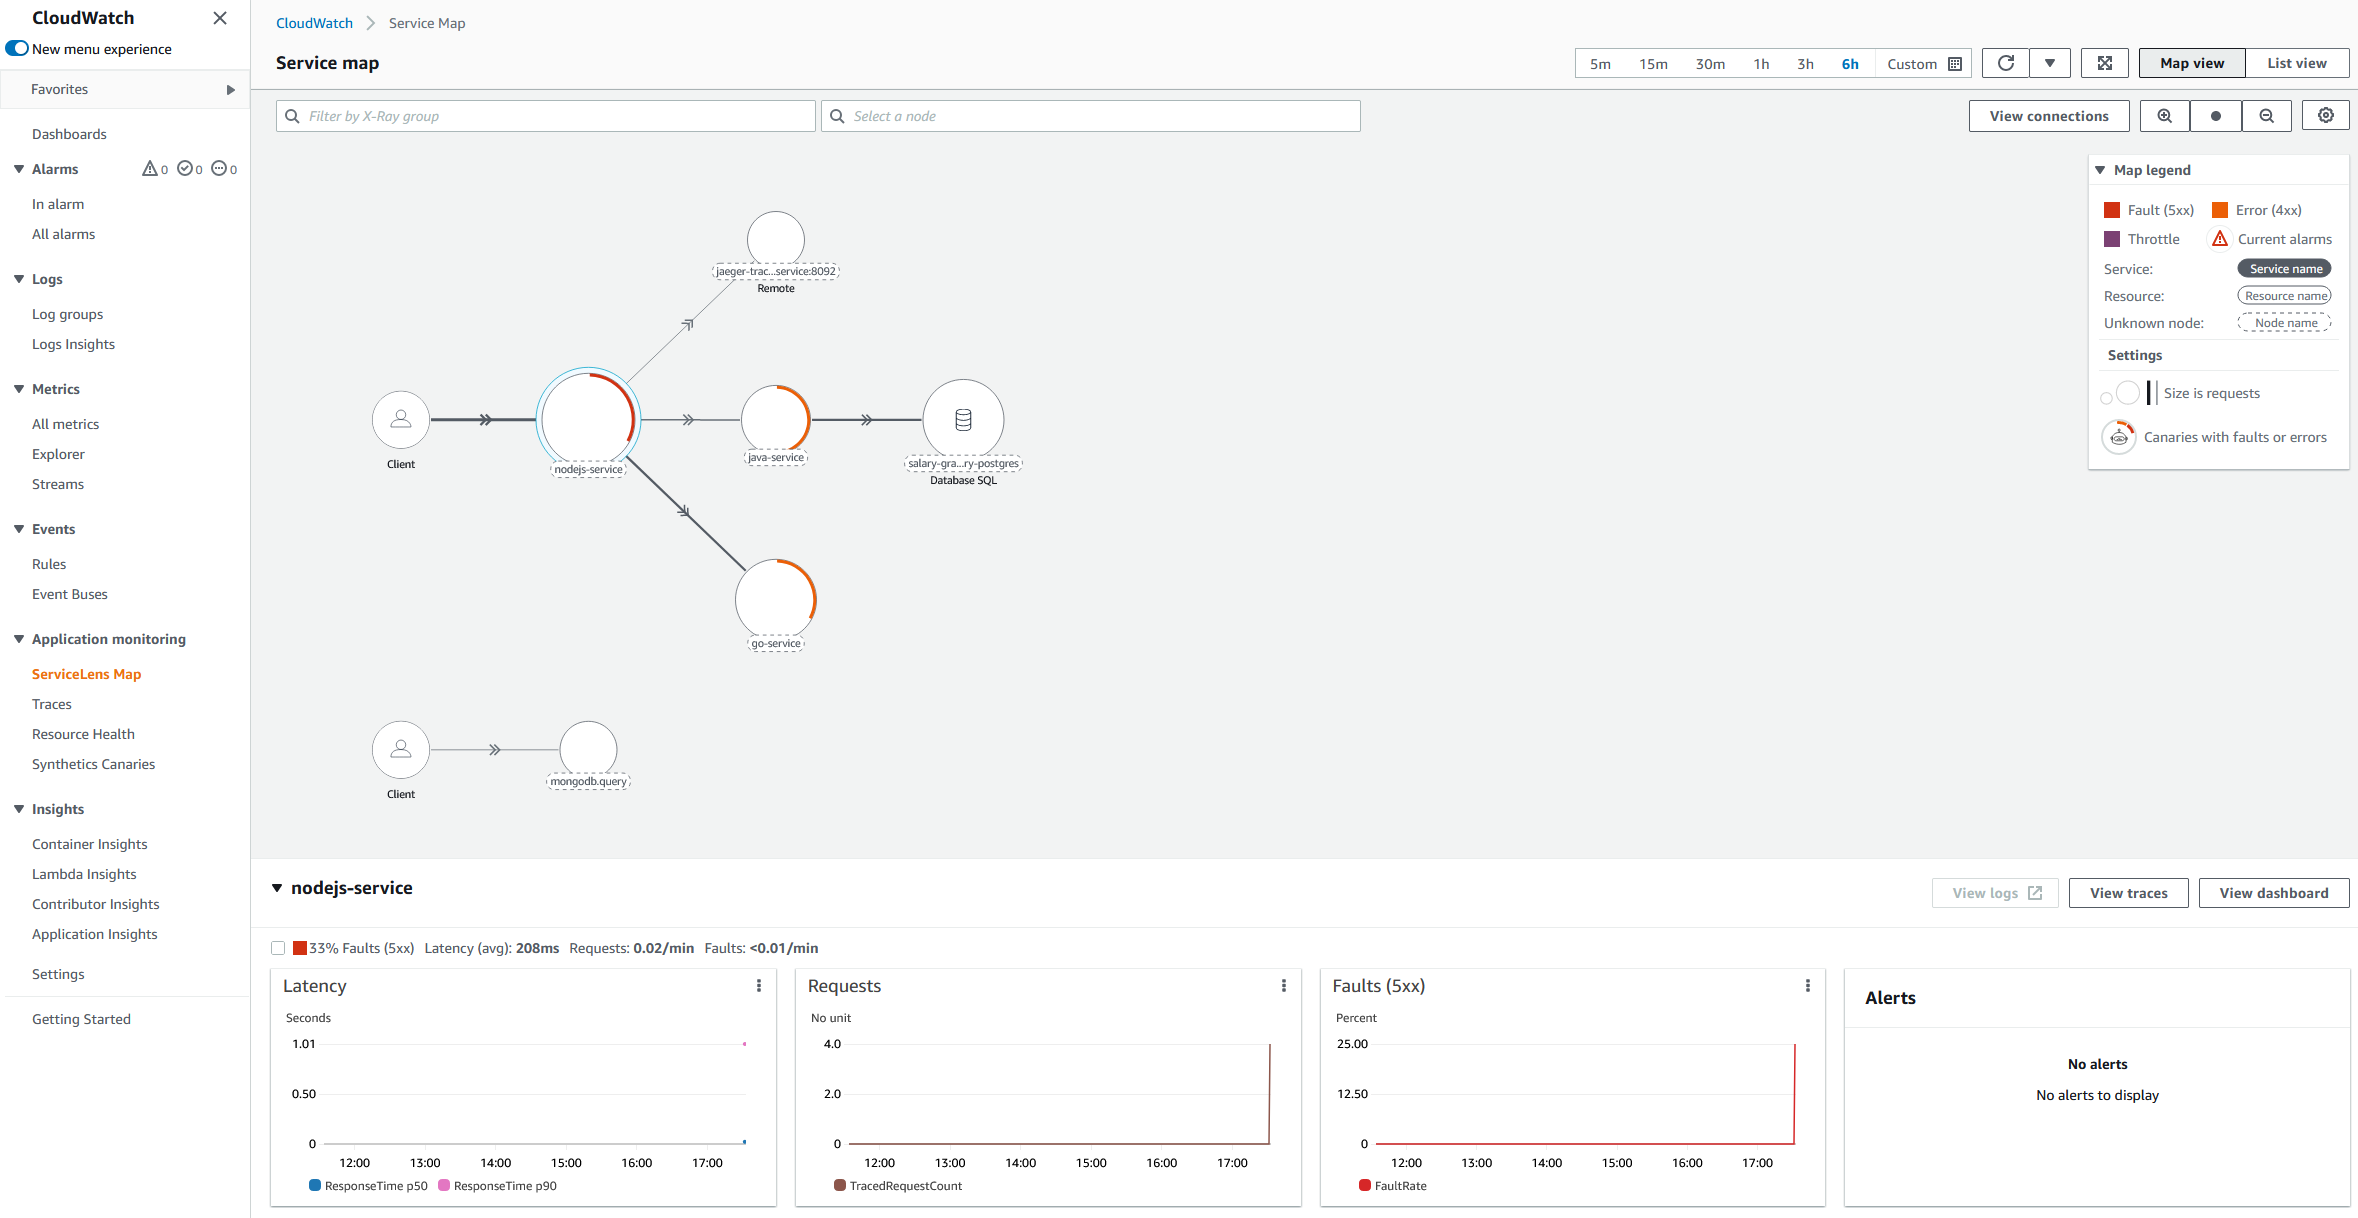
CloudWatch ServiceLens
CloudWatch ServiceLens ties together CloudWatch metrics and logs, as well as traces from AWS X-Ray to give a complete view of your applications and their dependencies
Let’s head to the CloudWatch ServiceLens console. The following command gives a direct link to the CloudWatch ServiceLens console:
echo "https://${AWS_REGION}.console.aws.amazon.com/cloudwatch/home?region=${AWS_REGION}#servicelens:service-map/map"
The ServiceLens provides us a visualization of both the Container Insight metrics & X-Ray traces gathered by
our OpenTelemetry Collector.