Observability Setup
Enable Amazon Cloudwatch Container Insights
Create an IAM role for the cloudwatch-agent service account
eksctl create iamserviceaccount \
  --cluster eksworkshop-eksctl \
  --namespace amazon-cloudwatch \
  --name cloudwatch-agent \
  --attach-policy-arn  arn:aws:iam::aws:policy/CloudWatchAgentServerPolicy \
  --override-existing-serviceaccounts \
  --approve
Create an IAM role for the fluent service account
eksctl create iamserviceaccount \
  --cluster eksworkshop-eksctl \
  --namespace amazon-cloudwatch \
  --name fluentd \
  --attach-policy-arn  arn:aws:iam::aws:policy/CloudWatchAgentServerPolicy \
  --override-existing-serviceaccounts \
  --approve
Now, Deploy Container Insights for Managed Nodegroup
curl -s https://raw.githubusercontent.com/aws-samples/amazon-cloudwatch-container-insights/latest/k8s-deployment-manifest-templates/deployment-mode/daemonset/container-insights-monitoring/quickstart/cwagent-fluentd-quickstart.yaml | sed "s/{{cluster_name}}/eksworkshop-eksctl/;s/{{region_name}}/${AWS_REGION}/" | kubectl apply -f -
The command above will:
- Create the
Namespace amazon-cloudwatch.
- Create all the necessary security objects for both DaemonSet:
SecurityAccount.ClusterRole.ClusterRoleBinding.
- Deploy Cloudwatch-Agent (responsible for sending the metrics to CloudWatch) as a
DaemonSet.
- Deploy fluentd (responsible for sending the logs to Cloudwatch) as a
DaemonSet.
- Deploy
ConfigMap configurations for both DaemonSets.
You can find the full information and manual install steps here.
You can verify all the DaemonSets have been deployed by running the following command.
kubectl -n amazon-cloudwatch get daemonsets
You can also verify the deployment of DaemonSets by logging into console and navigate to Amazon EKS -> Cluster -> Workloads,

Enable Prometheus Metrics in CloudWatch
Create an IAM role for the prometheus service account
eksctl create iamserviceaccount \
  --cluster eksworkshop-eksctl \
  --namespace amazon-cloudwatch \
  --name cwagent-prometheus \
  --attach-policy-arn  arn:aws:iam::aws:policy/CloudWatchAgentServerPolicy \
  --override-existing-serviceaccounts \
  --approve
Install Prometheus Agent
kubectl apply -f https://raw.githubusercontent.com/aws-samples/amazon-cloudwatch-container-insights/latest/k8s-deployment-manifest-templates/deployment-mode/service/cwagent-prometheus/prometheus-eks.yaml
Confirm that the agent is running
kubectl get pod -l "app=cwagent-prometheus" -n amazon-cloudwatch
Enable Logging for Fargate
Amazon EKS with Fargate supports a built-in log router, which means there are no sidecar containers to install or maintain. Apply a ConfigMap to your Amazon EKS cluster with a Fluent Conf data value that defines where container logs are shipped to.
This logging ConfigMap has to be used in a fixed namespace called aws-observability has a cluster-wide effect, meaning that you can send application-level logs from any application in any namespace.
In this workshop, we will show you how to use cloudwatch_logs to send logs from a workload running in an EKS on Fargate cluster to CloudWatch.
First, create the dedicated aws-observability namespace and the ConfigMap for Fluent Bit
cd eks-app-mesh-polyglot-demo
envsubst < ./deployment/fluentbit-config.yaml | kubectl apply -f -
Next, verify if the Fluent Bit ConfigMap is deployed correctly
kubectl -n aws-observability get cm
With Fluent Bit set up we next need to give it the permission to write to CloudWatch. We do that by first downloading the policy locally:
curl -o permissions.json \
     https://raw.githubusercontent.com/aws-samples/amazon-eks-fluent-logging-examples/mainline/examples/fargate/cloudwatchlogs/permissions.json
And next we create the policy:
aws iam create-policy \
        --policy-name FluentBitEKSFargate \
        --policy-document file://permissions.json
And then, Attach the Policy to the Pod Execution Role of our EKS on Fargate cluster
export PodRole=$(aws eks describe-fargate-profile --cluster-name eksworkshop-eksctl --fargate-profile-name fargate-productcatalog --query 'fargateProfile.podExecutionRoleArn' | sed -n 's/^.*role\/\(.*\)".*$/\1/ p')
aws iam attach-role-policy \
        --policy-arn arn:aws:iam::${ACCOUNT_ID}:policy/FluentBitEKSFargate \
        --role-name ${PodRole}
echo $PodRole
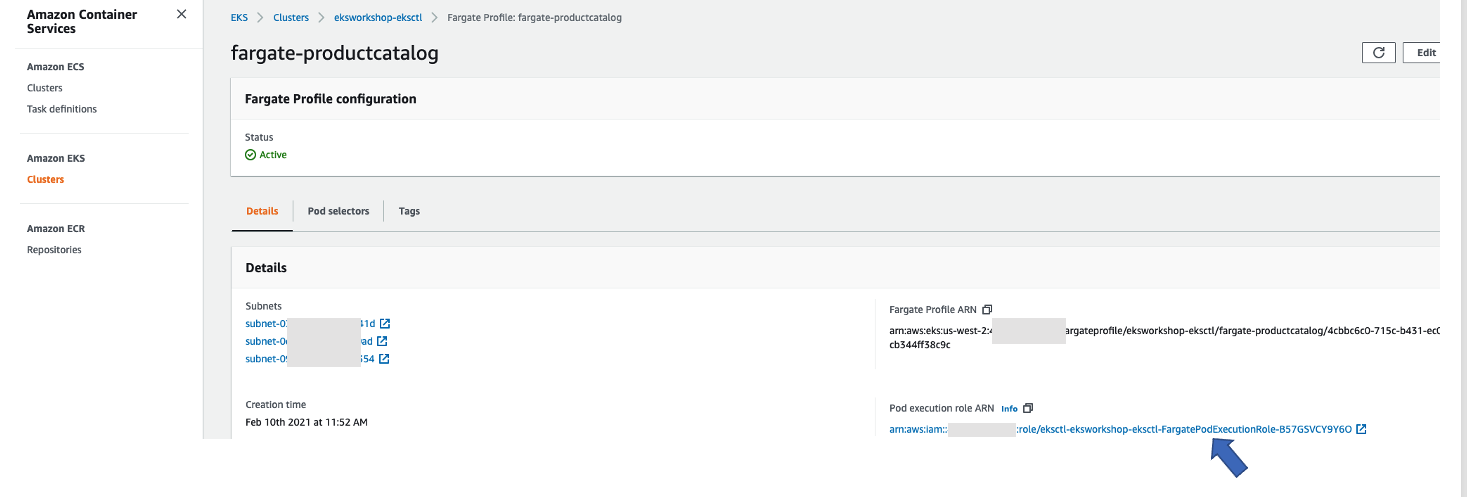
Log into console and navigate to EKS -> Cluster -> Configuration-> Compute, select fargate-productcatalog Fargate Profile, you will see the below page.

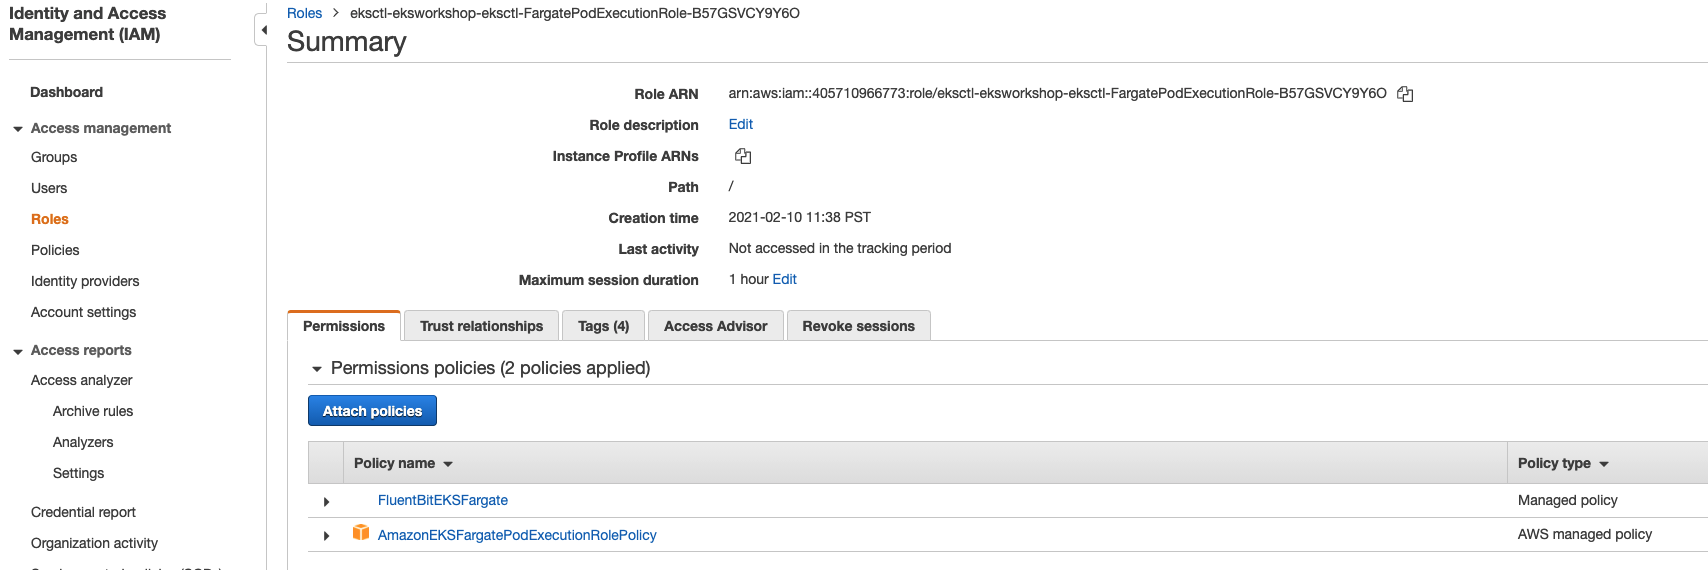
Click on the Pod Execution Role. You should see the below FluentBitEKSFargate policy that was attached to the Pod Execution Role.

(Optional) Enable Amazon EKS Control Plane logs
If you enable Amazon EKS Control Plane logging, you will be charged the standard CloudWatch Logs data ingestion and storage costs for any logs sent to CloudWatch Logs from your cluster. You are also charged for any AWS resources, such as Amazon EC2 instances or Amazon EBS volumes, that you provision as part of your cluster.
CloudWatch logging for EKS control plane is not enabled by default due to data ingestion and storage costs. You can enable using below command.
eksctl utils update-cluster-logging \
    --enable-types all \
    --region ${AWS_REGION} \
    --cluster eksworkshop-eksctl \
    --approve
You can log into console and navigate to Amazon EKS -> Cluster -> Logging
![\[Image NOT FOUND\]](../../../../images/app_mesh_fargate/consolecontrol.png)
Congratulations!! You have completed the basic setup for EKS and Observability, Now lets move to the fun part of deploying our Product Catalog Application.


![\[Image NOT FOUND\]](../../../../images/app_mesh_fargate/consolecontrol.png)