Setup Grafana
In the previous section we exported Kubernetes Control Plane metrics to our AMP workspace. Now let’s visualize this data using Grafana.
This workshop uses open source Grafana. This is due to a limitation on the AWS EventEngine tool not yet supporting AWS Managed Grafana (AMG). If you are doing this lab on your own account, you can use AWS Managed Grafana.
Deploying Grafana
First install Helm
curl -fsSL -o /tmp/get_helm.sh https://raw.githubusercontent.com/helm/helm/master/scripts/get-helm-3
chmod +x /tmp/get_helm.sh
/tmp/get_helm.sh
helm version
Then, update the Grafana configuration with our AWS Account specific configuration
envsubst < kubernetes/adot/grafana.values | sponge kubernetes/adot/grafana.values
Now install Grafana onto our EKS Cluster using Helm
helm repo add grafana https://grafana.github.io/helm-charts
helm repo update
helm upgrade --install -n aws-otel-eks -f kubernetes/adot/grafana.values grafana grafana/grafana
Configuring AMP Data Source in Grafana
Grab the Grafana UI URL
export GRAFANA_SVC=$(kubectl -n aws-otel-eks get svc grafana --template "{{ range (index .status.loadBalancer.ingress 0) }}{{ . }}{{ end }}")
echo $GRAFANA_SVC
In a different browser tab, open the above URL. Note, it can take a few minutes for DNS to propegate. Credentials to login listed below.
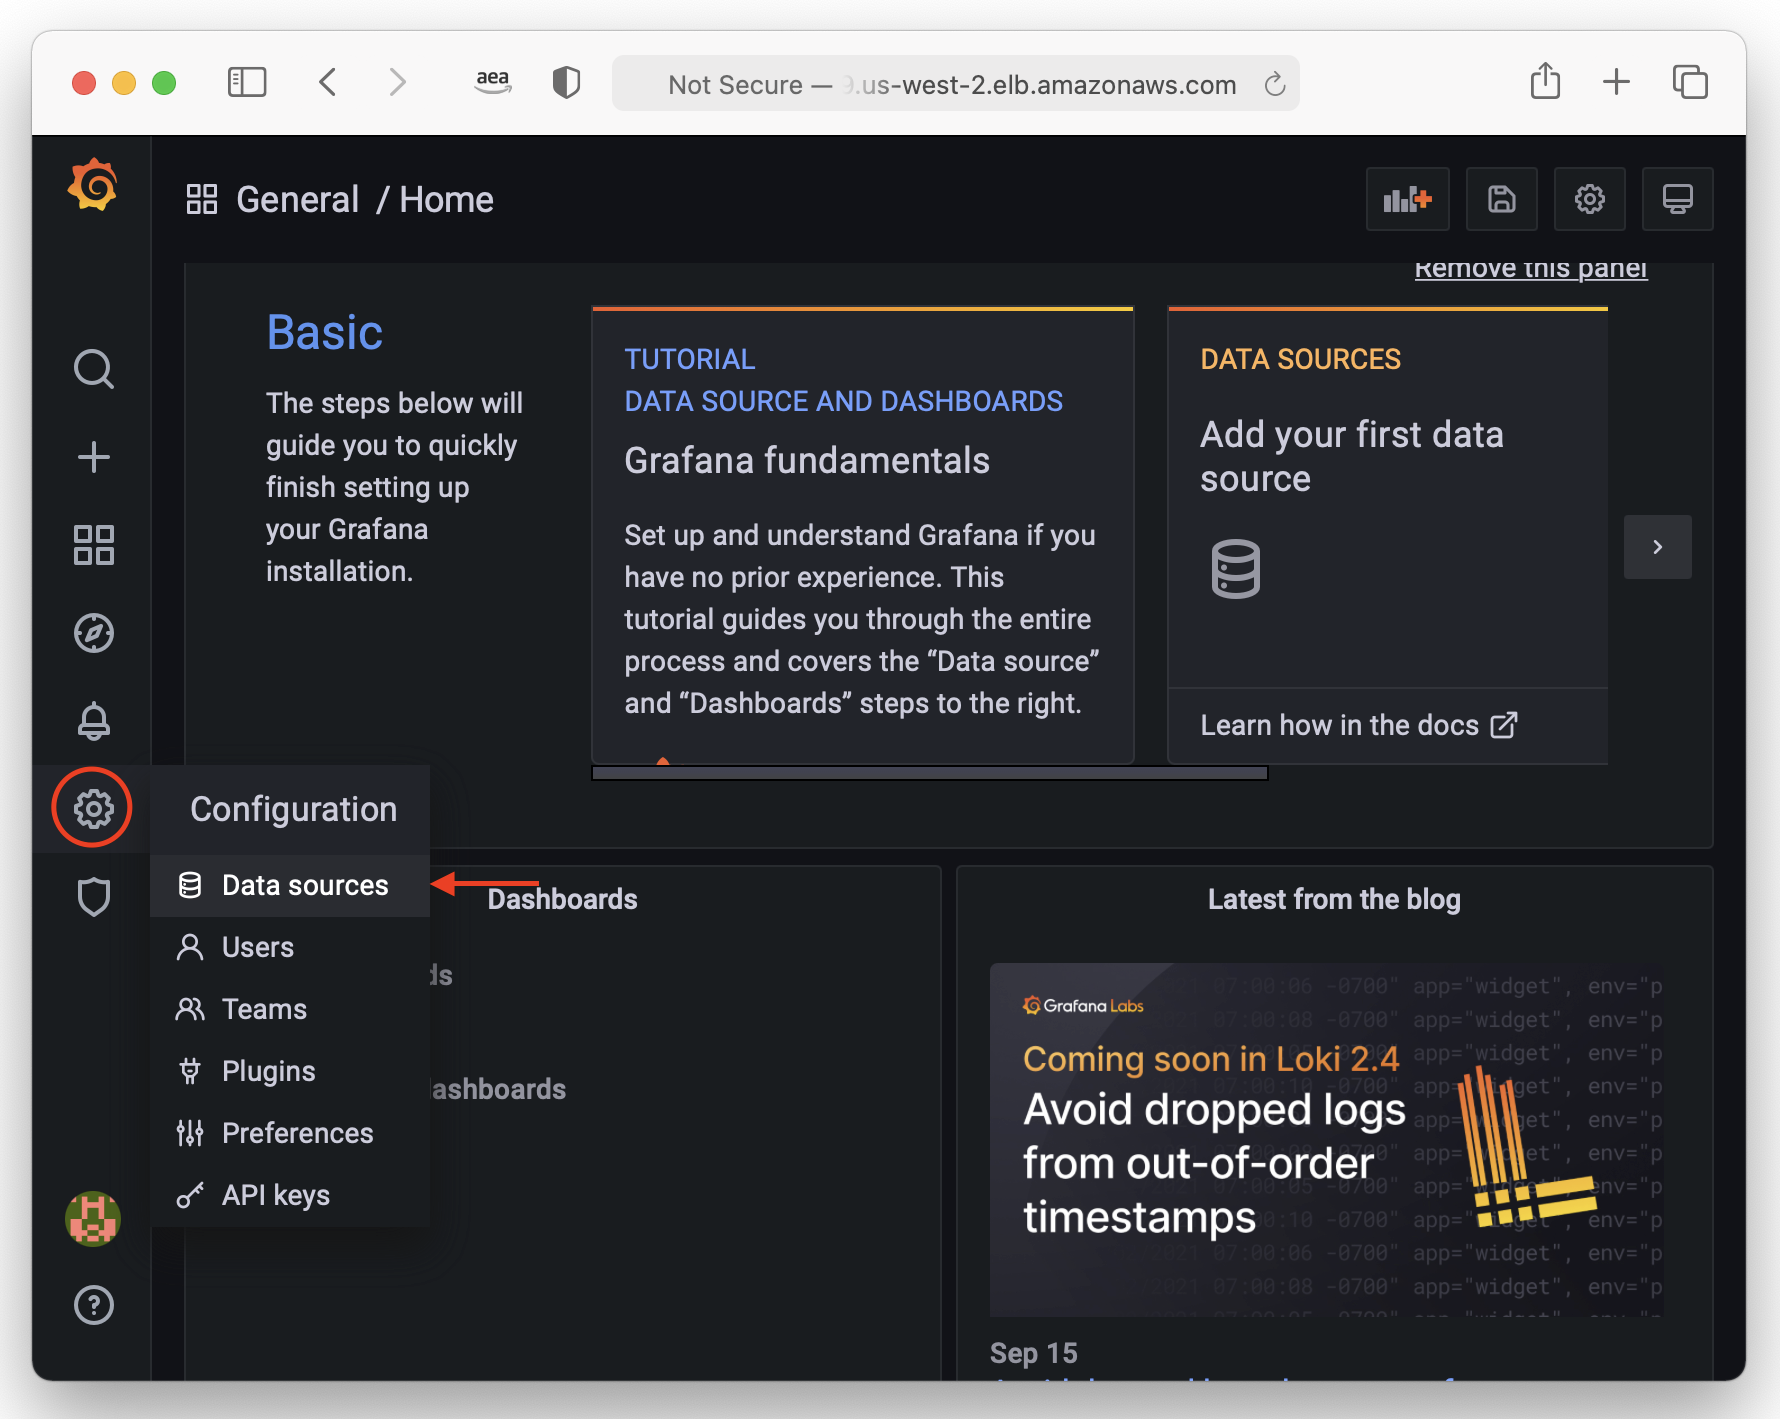
In the Grafana console select Configurations, and choose Data sources in the sub-menu.
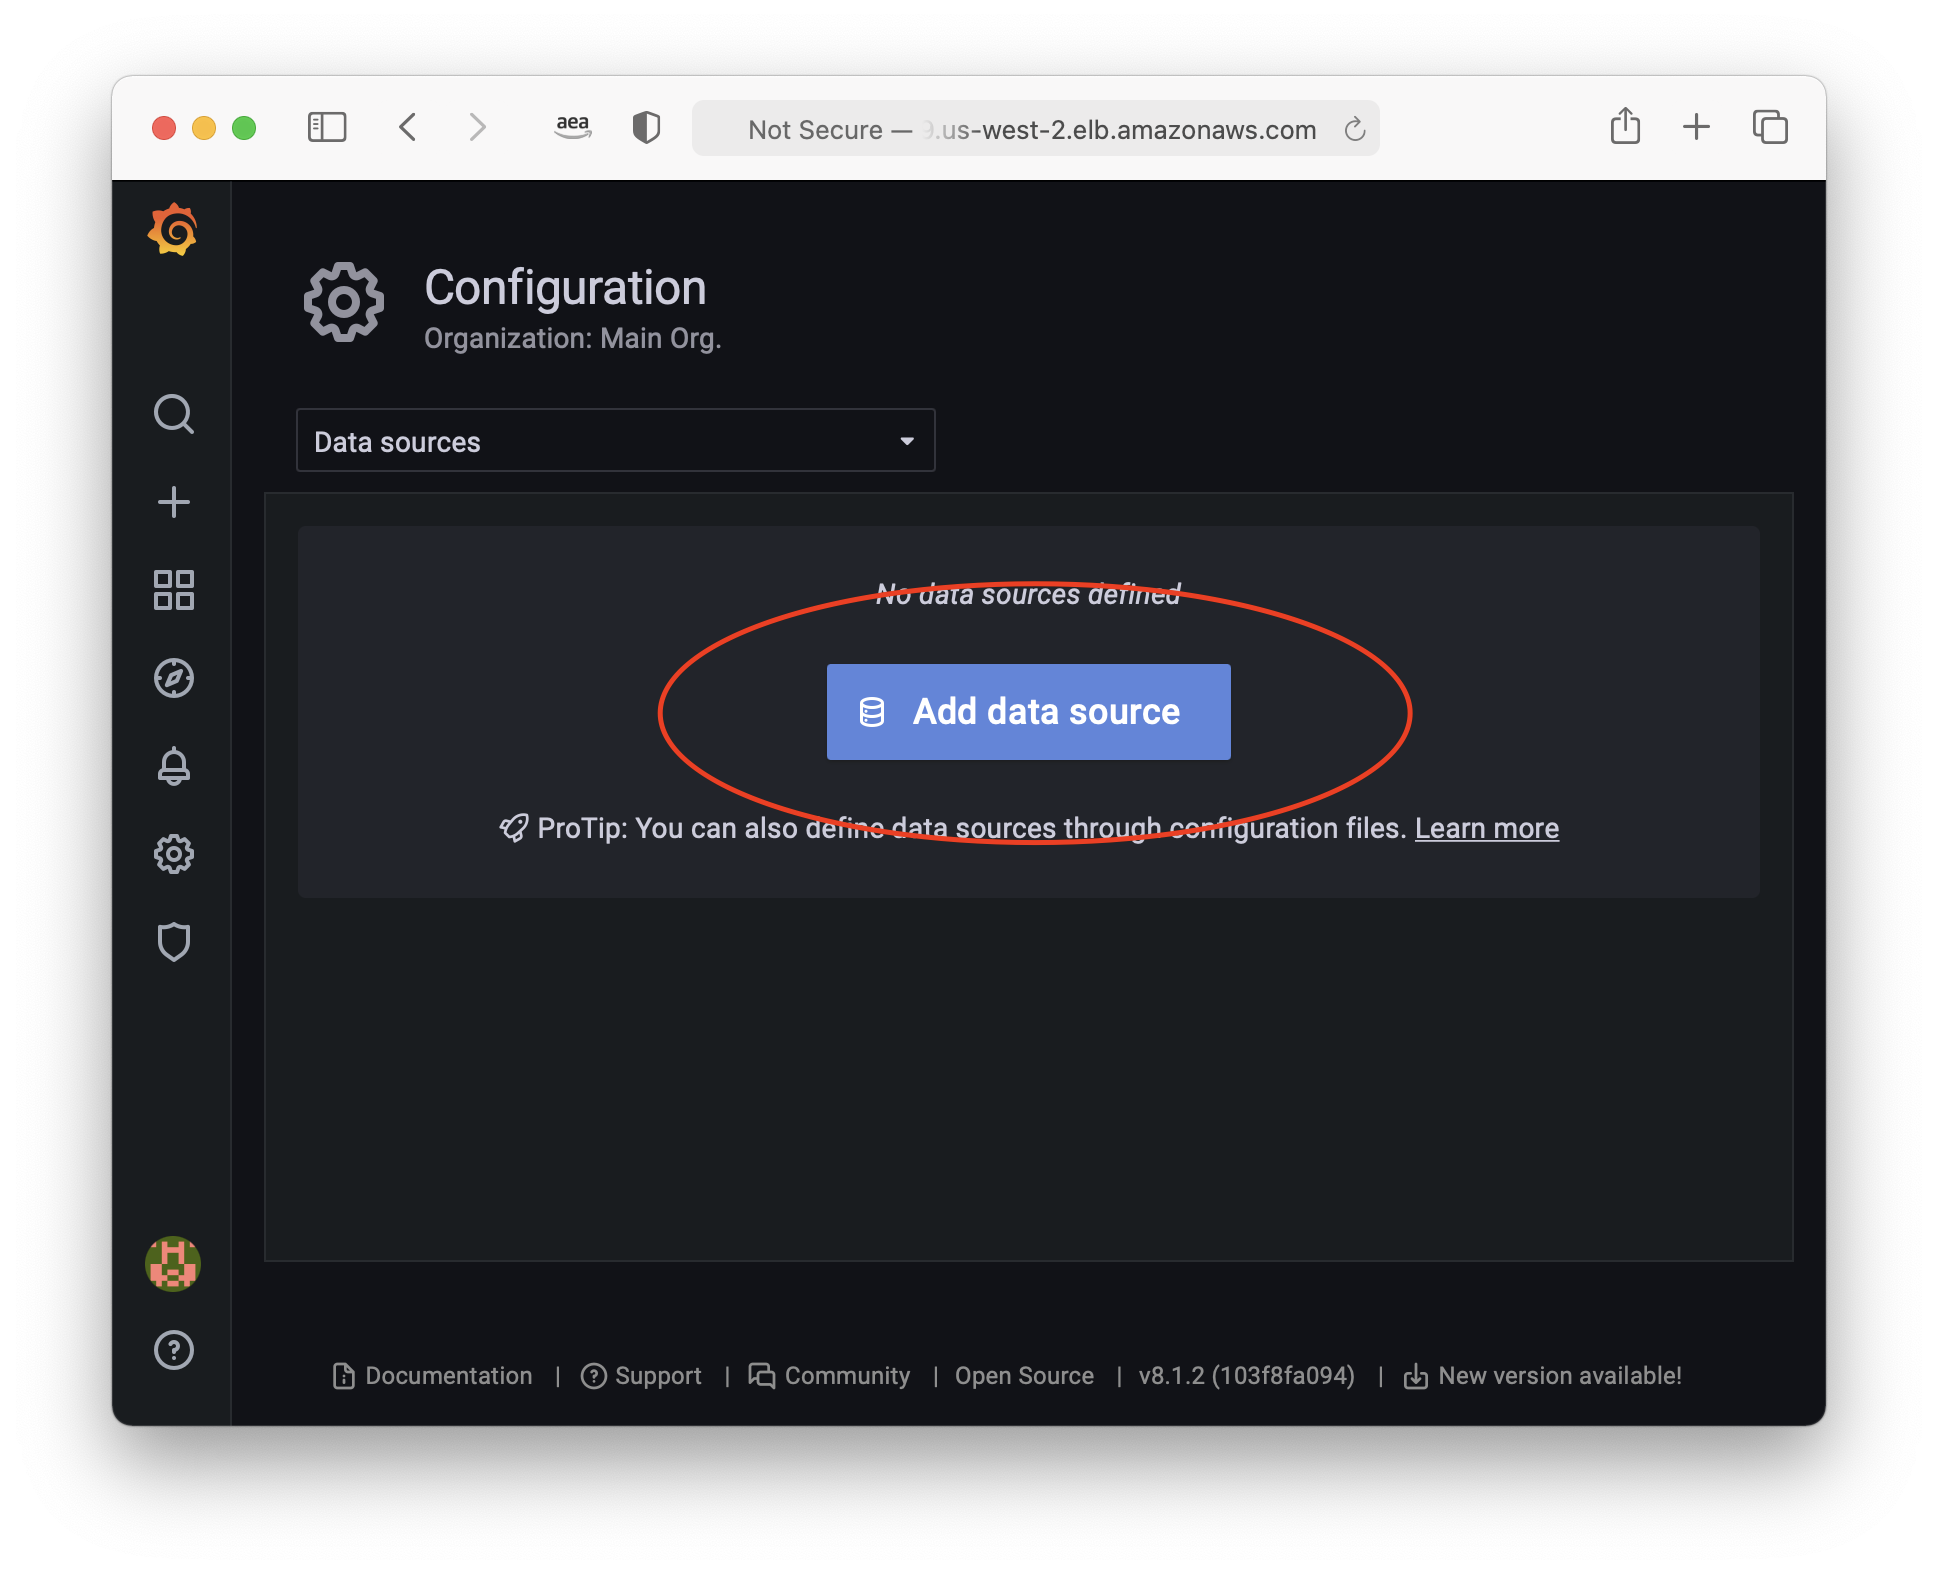
Select “Add Data source”
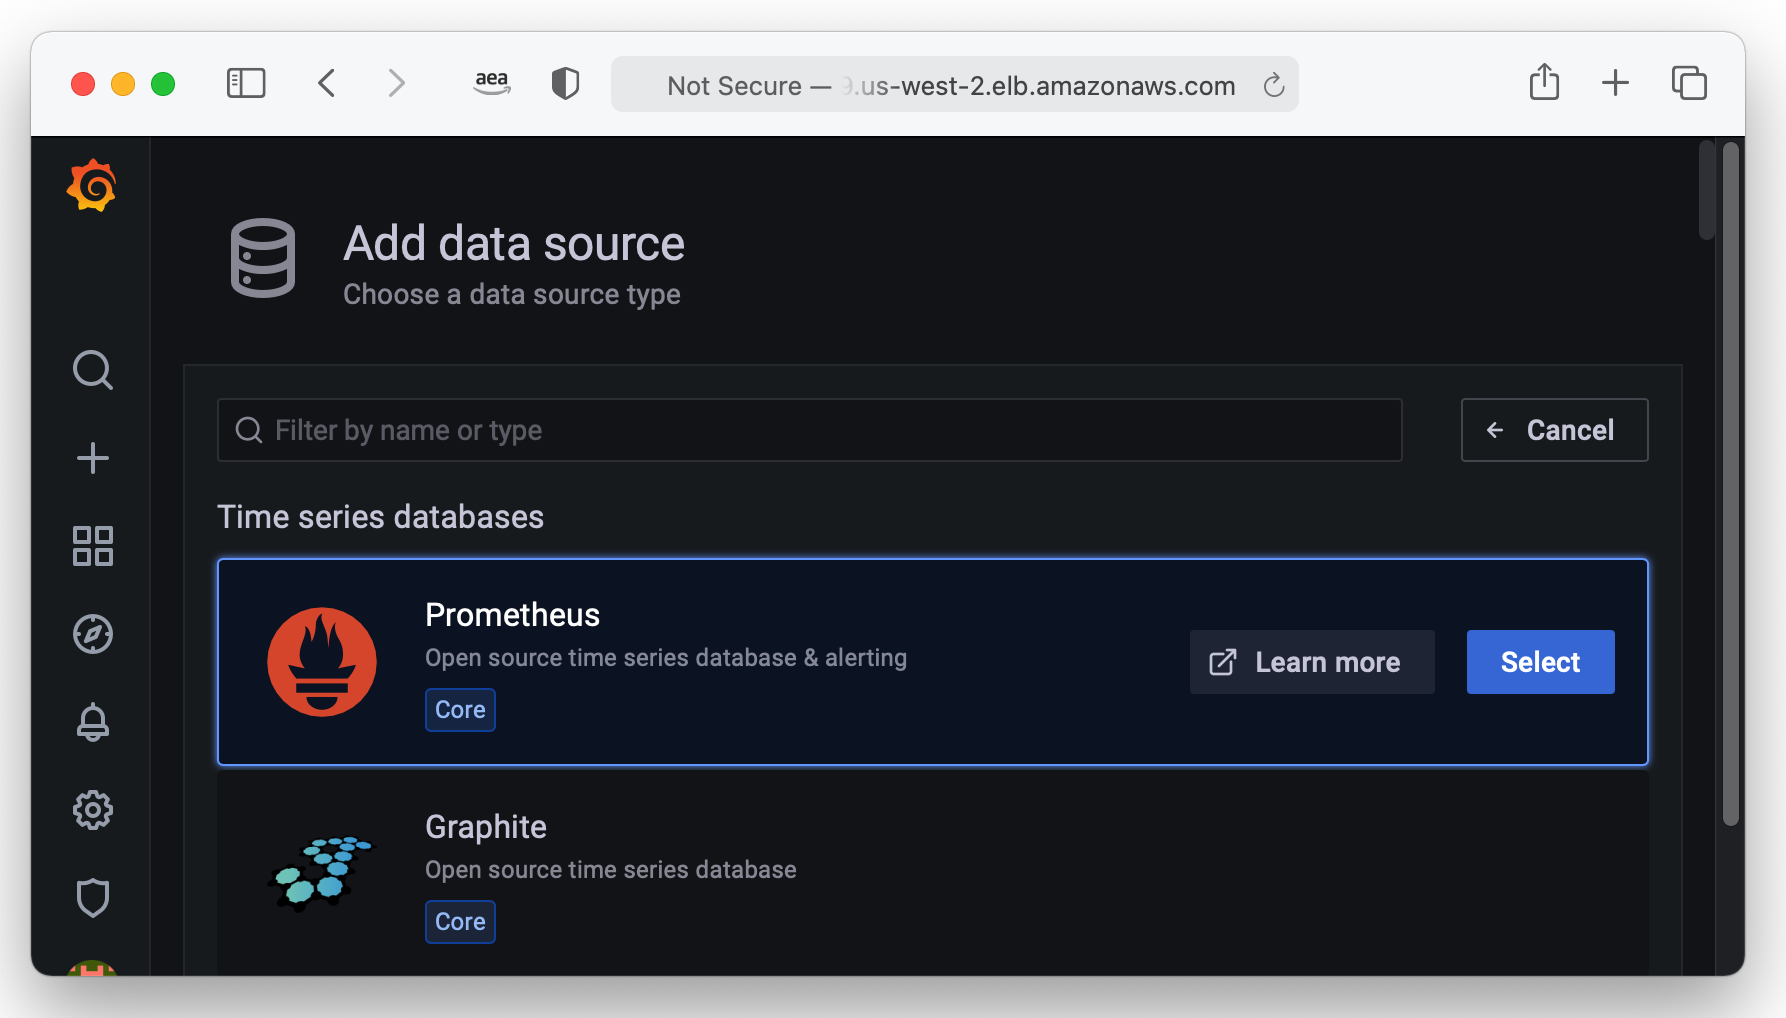
Choose Prometheus
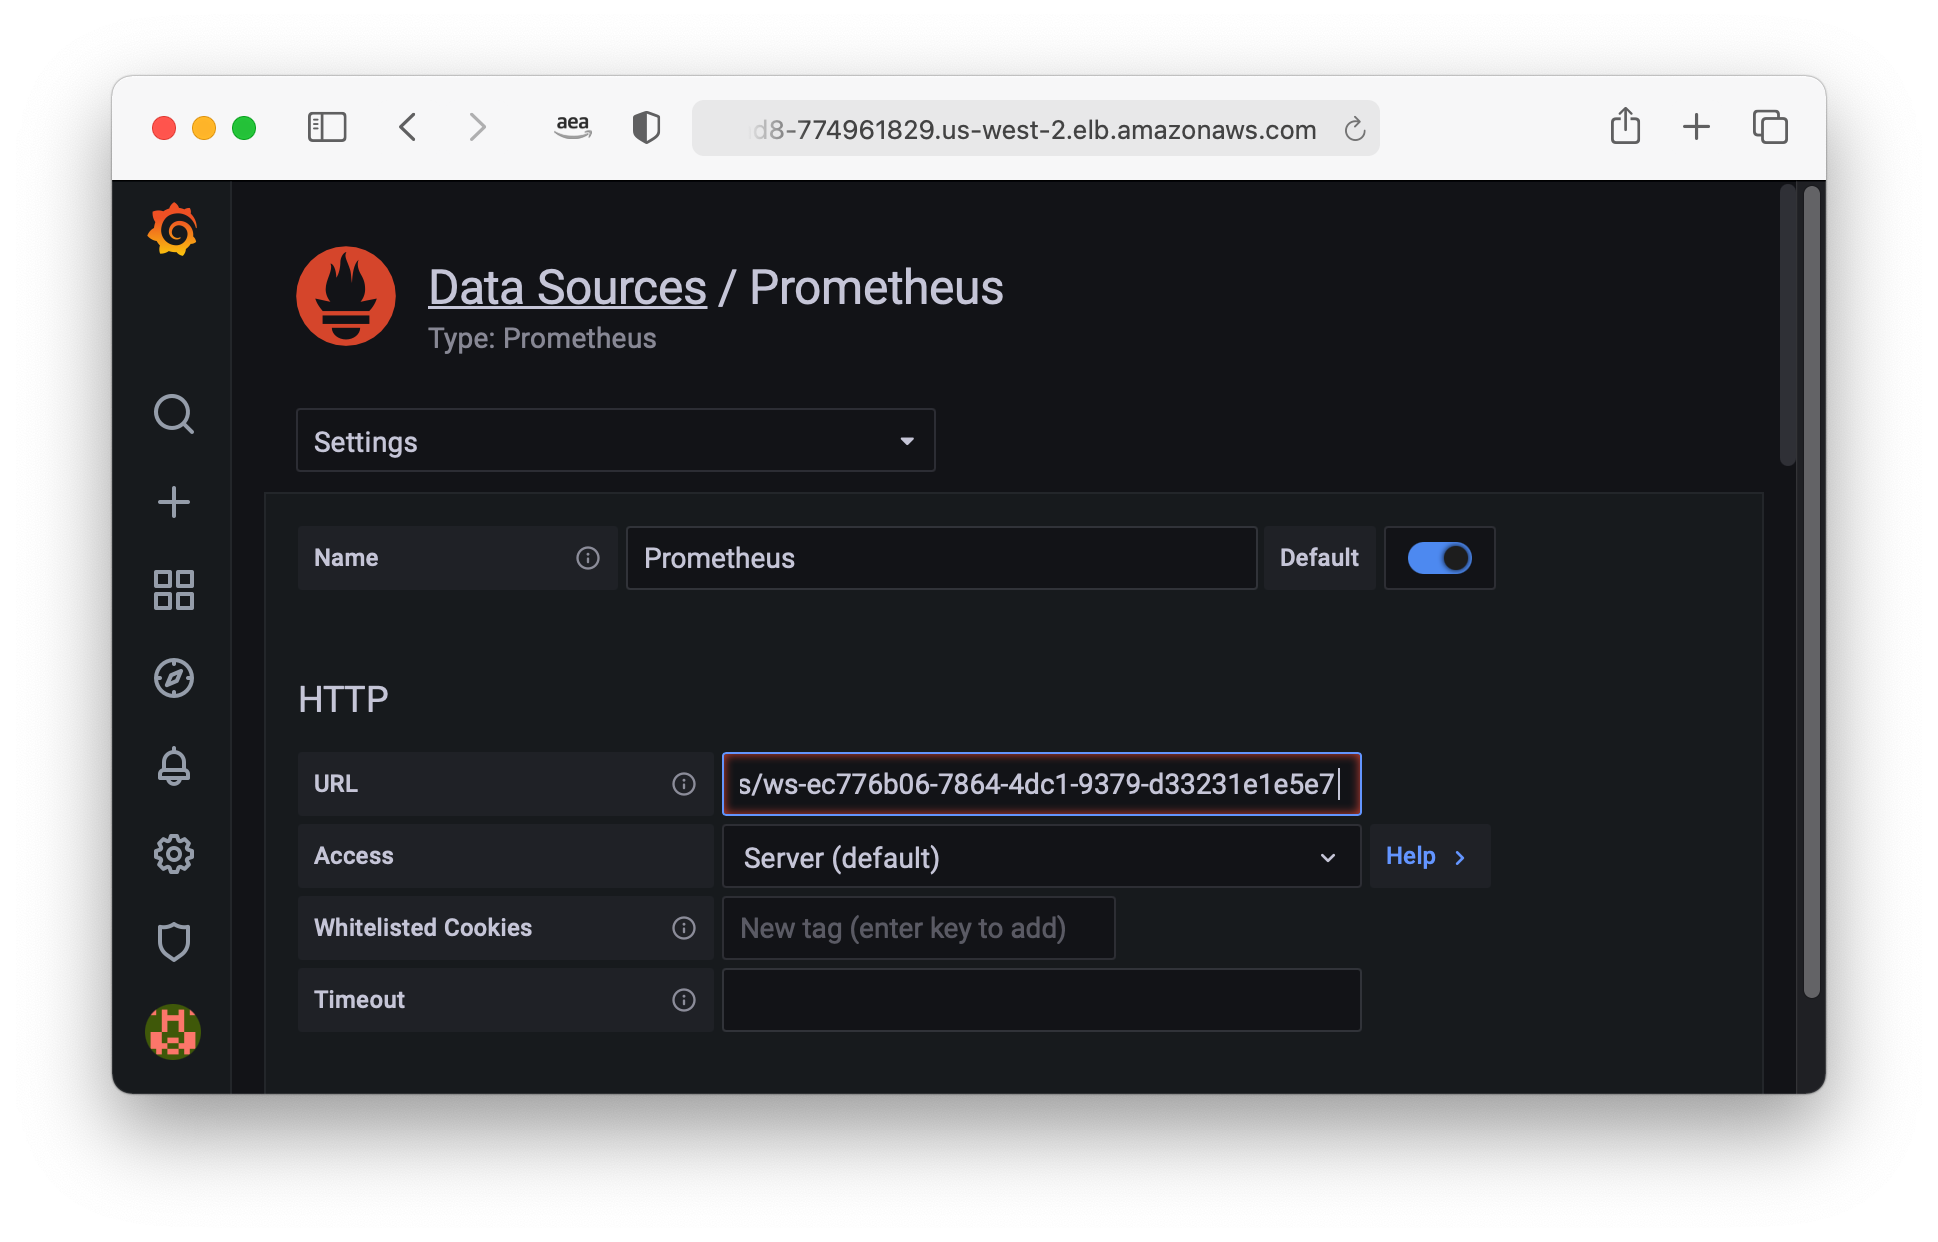
Get the endpoint for our AMP instance, and copy & paste it into Grafana for the HTTP > URL configuration
aws amp describe-workspace --workspace-id $WORKSPACE_ID | jq '.workspace.prometheusEndpoint' -r
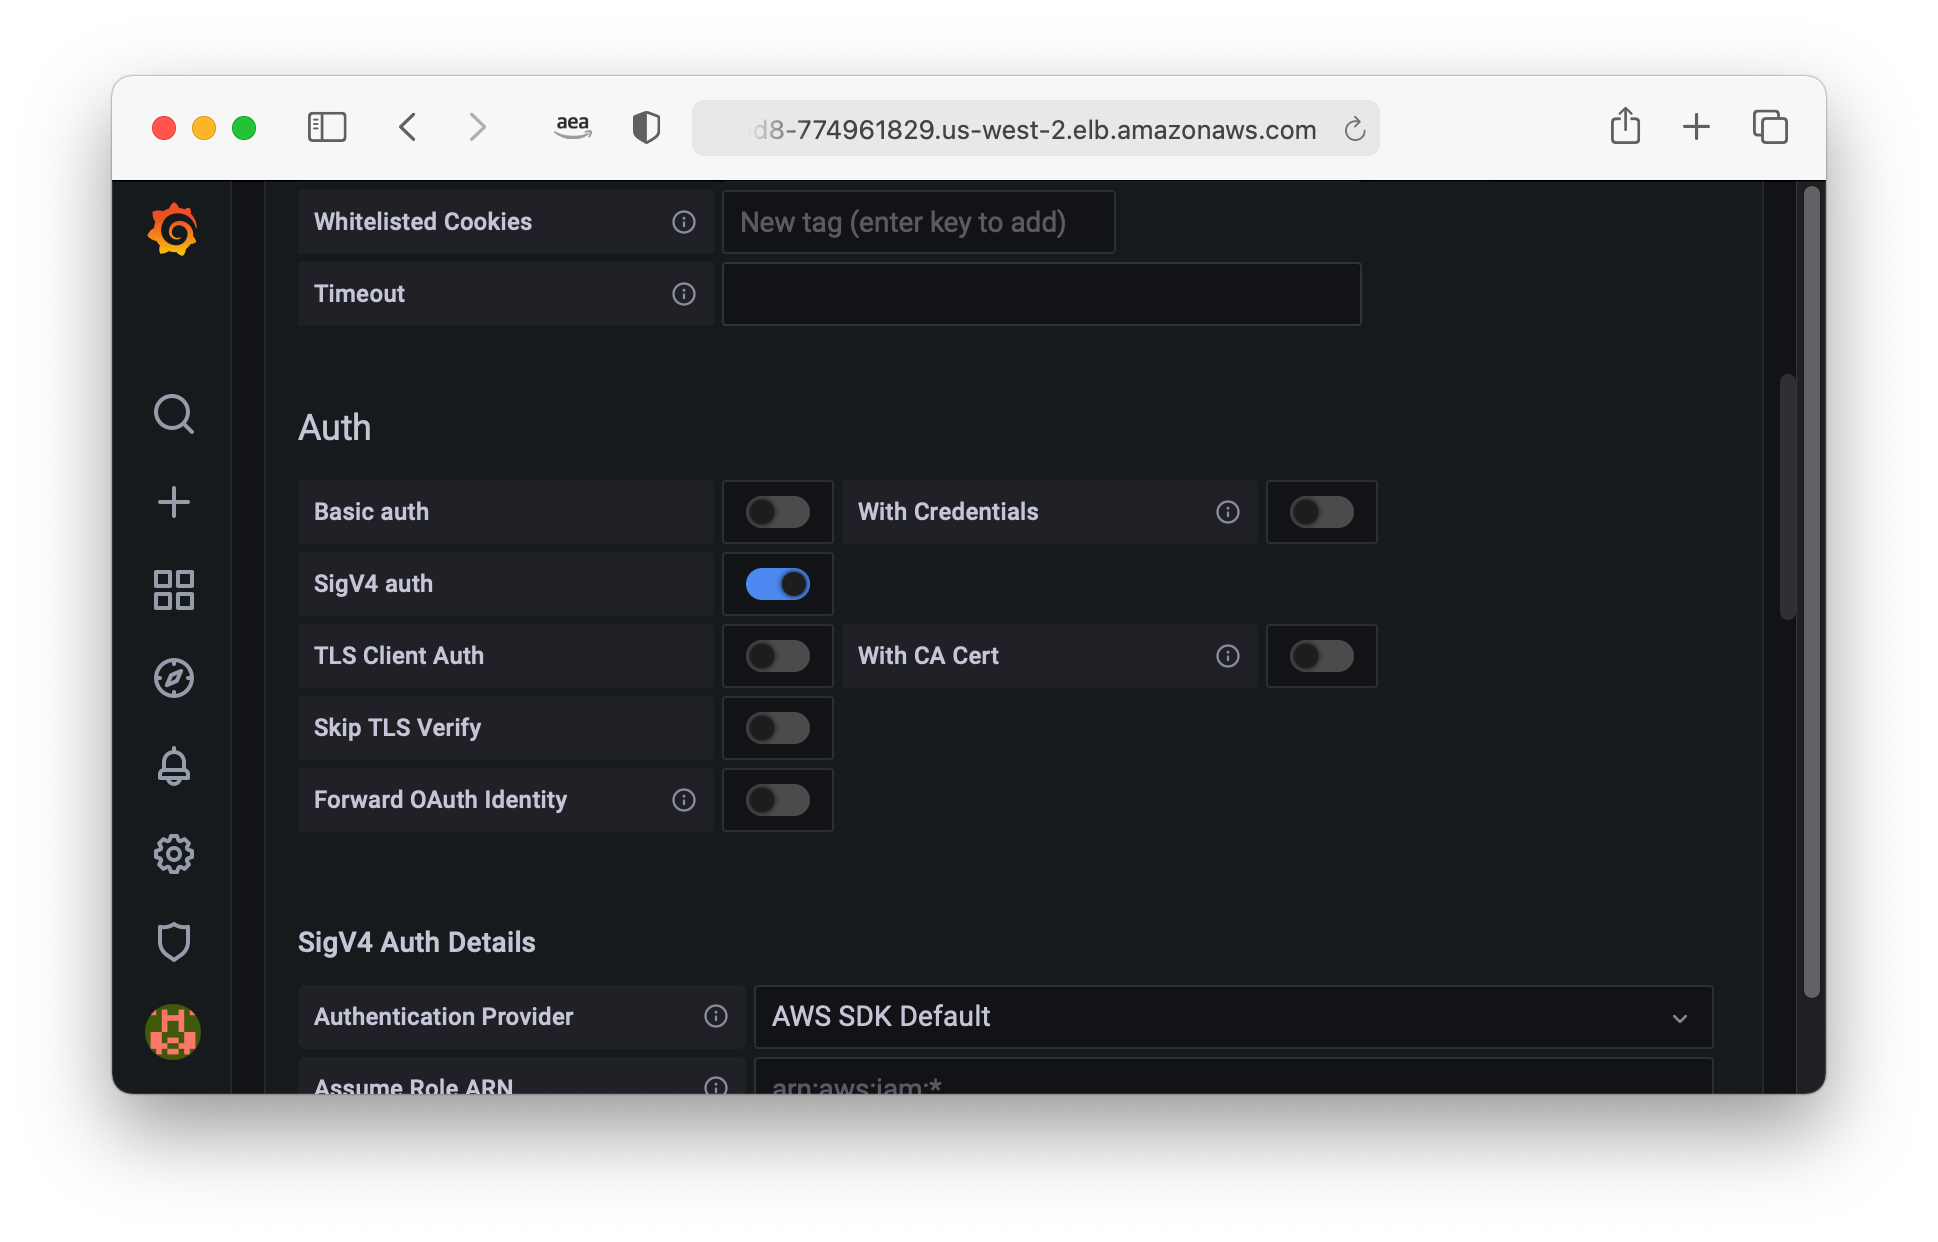
Scroll down to the Auth section, and select the toggle to enable SigV4 Auth.
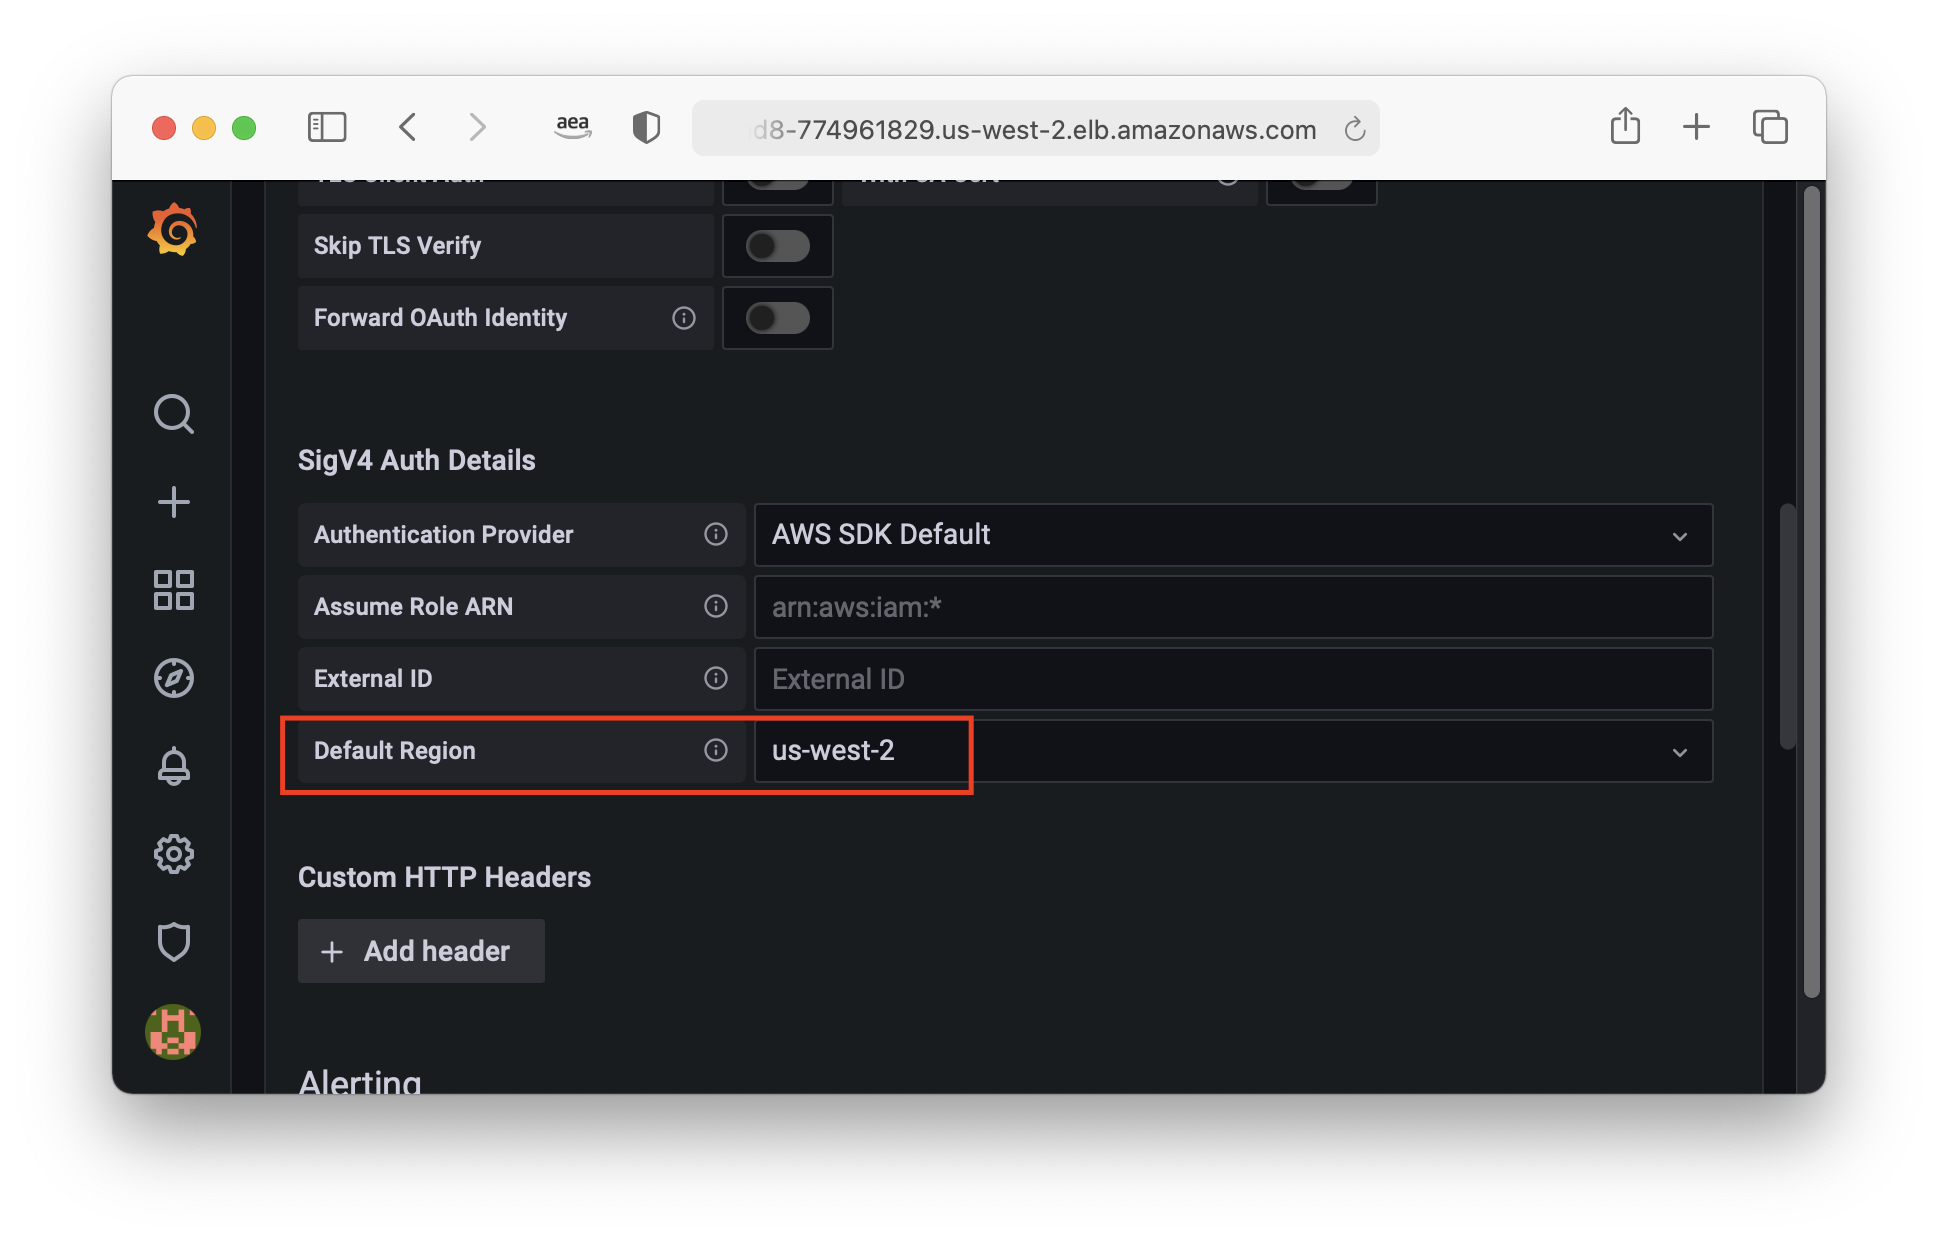
You’ll then have a SigV4 Auth Details configuration section appear. Set Default Region to the same AWS region of
your AMP Workspace. You can get the AWS Region by running $ echo $AWS_REGION.
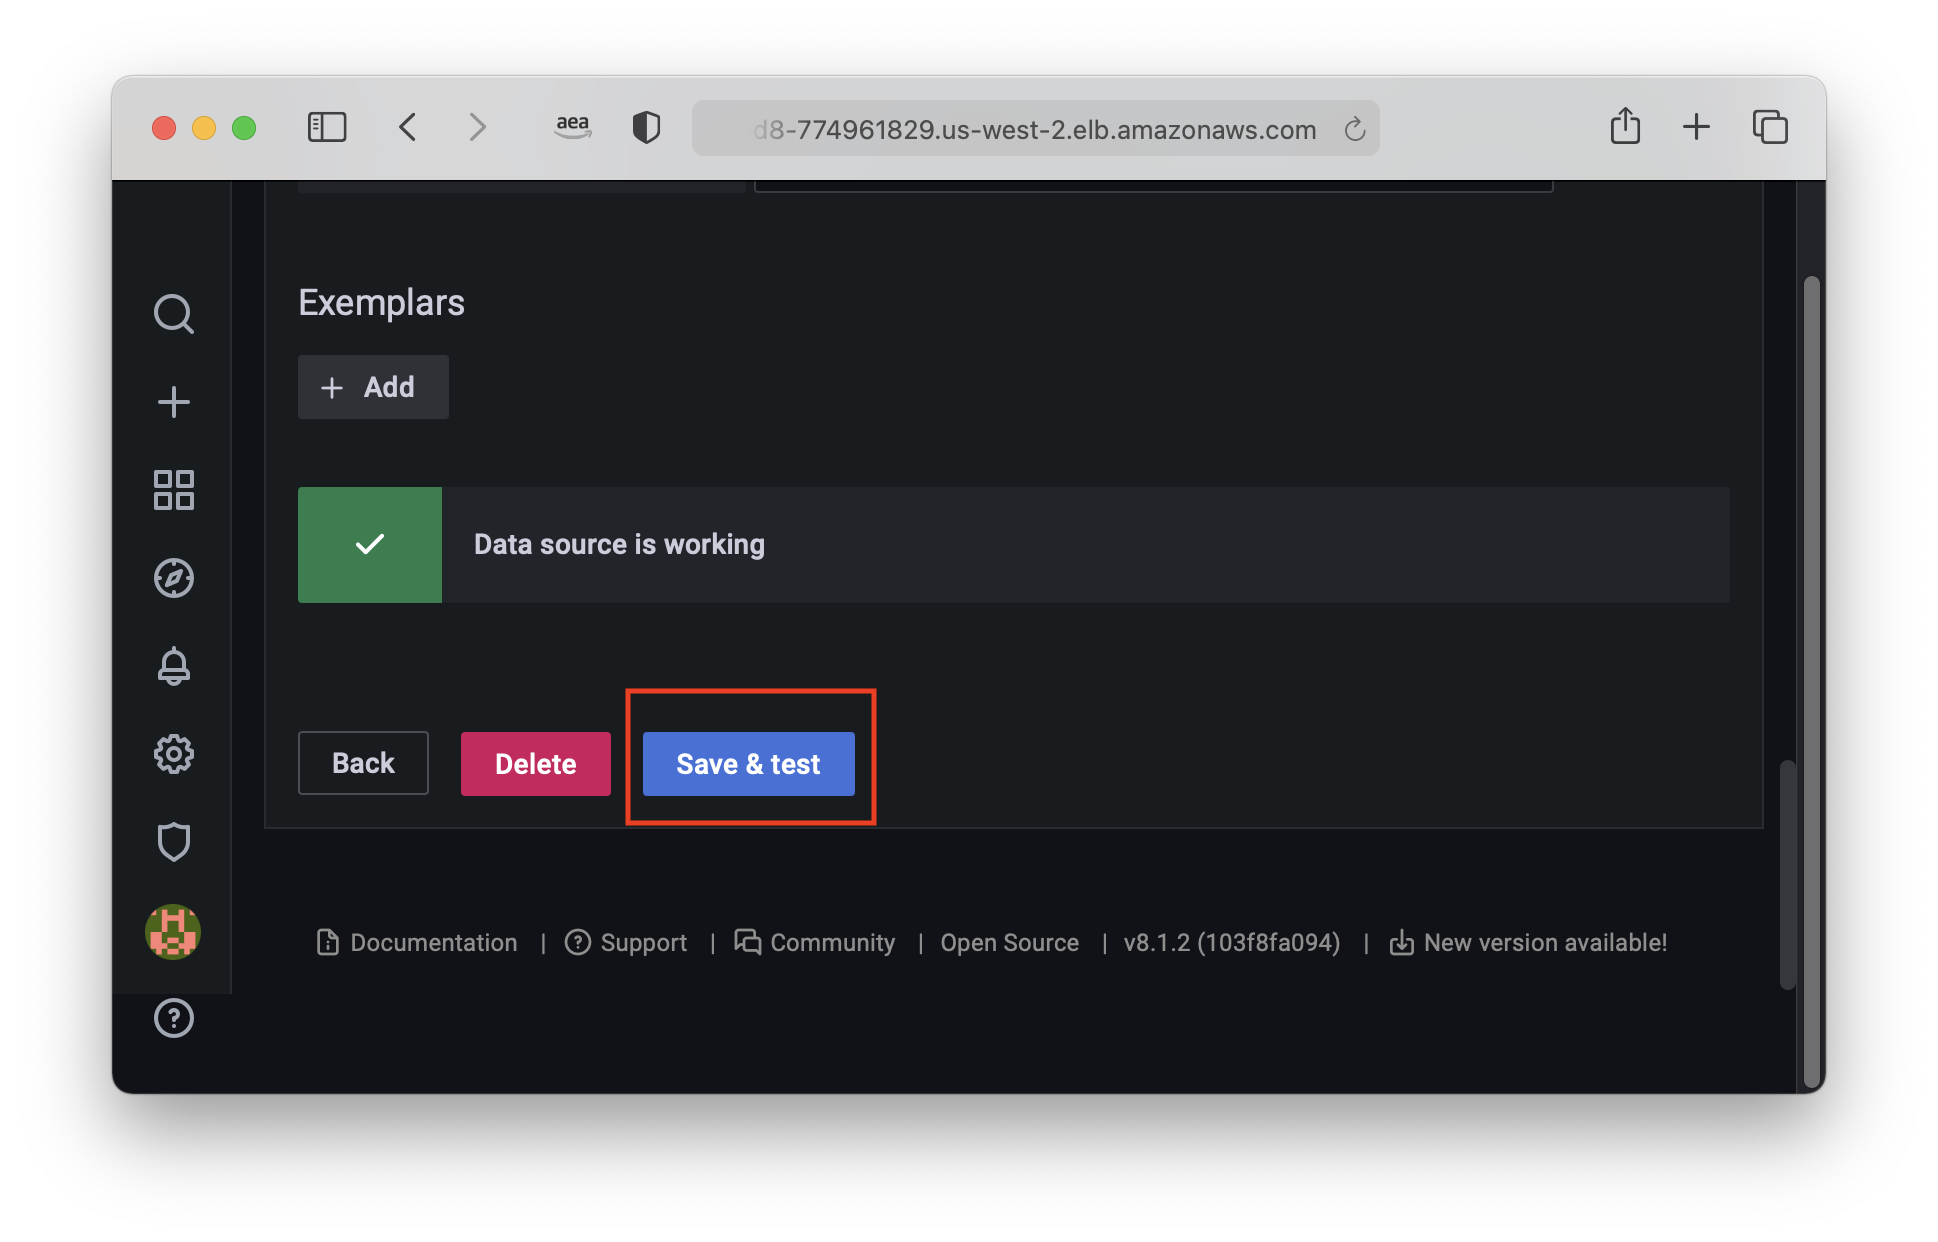
Scroll down to the bottom of the page, and select Save & Test. After testing is finished, you should see a green check-mark stating the Data source is working.
Grafana is now configured to read metrics from our AMP instance. In the next section we’ll cover visualizing these metrics with Grafana.