Argo Dashboard
Argo Dashboard
Since V2.5, Argo UI has been replace by Argo Server. The new UI is not read-only — it also comes with the ability to create and update data directly in your browser. Click here for more information

Access the Argo Server
To access the dashboard we will expose the argo-server service by adding a LoadBalancer.
kubectl -n argo patch svc argo-server  \
   -p '{"spec": {"type": "LoadBalancer"}}'
It will take several minutes for the ELB to become healthy and start passing traffic to the pods.
To access the Argo Dashboard, click on the URL generated by the these commands:
ARGO_URL=$(kubectl -n argo get svc argo-server --template "{{ range (index .status.loadBalancer.ingress 0) }}{{ . }}{{ end }}")

echo ARGO DASHBOARD: http://${ARGO_URL}:2746
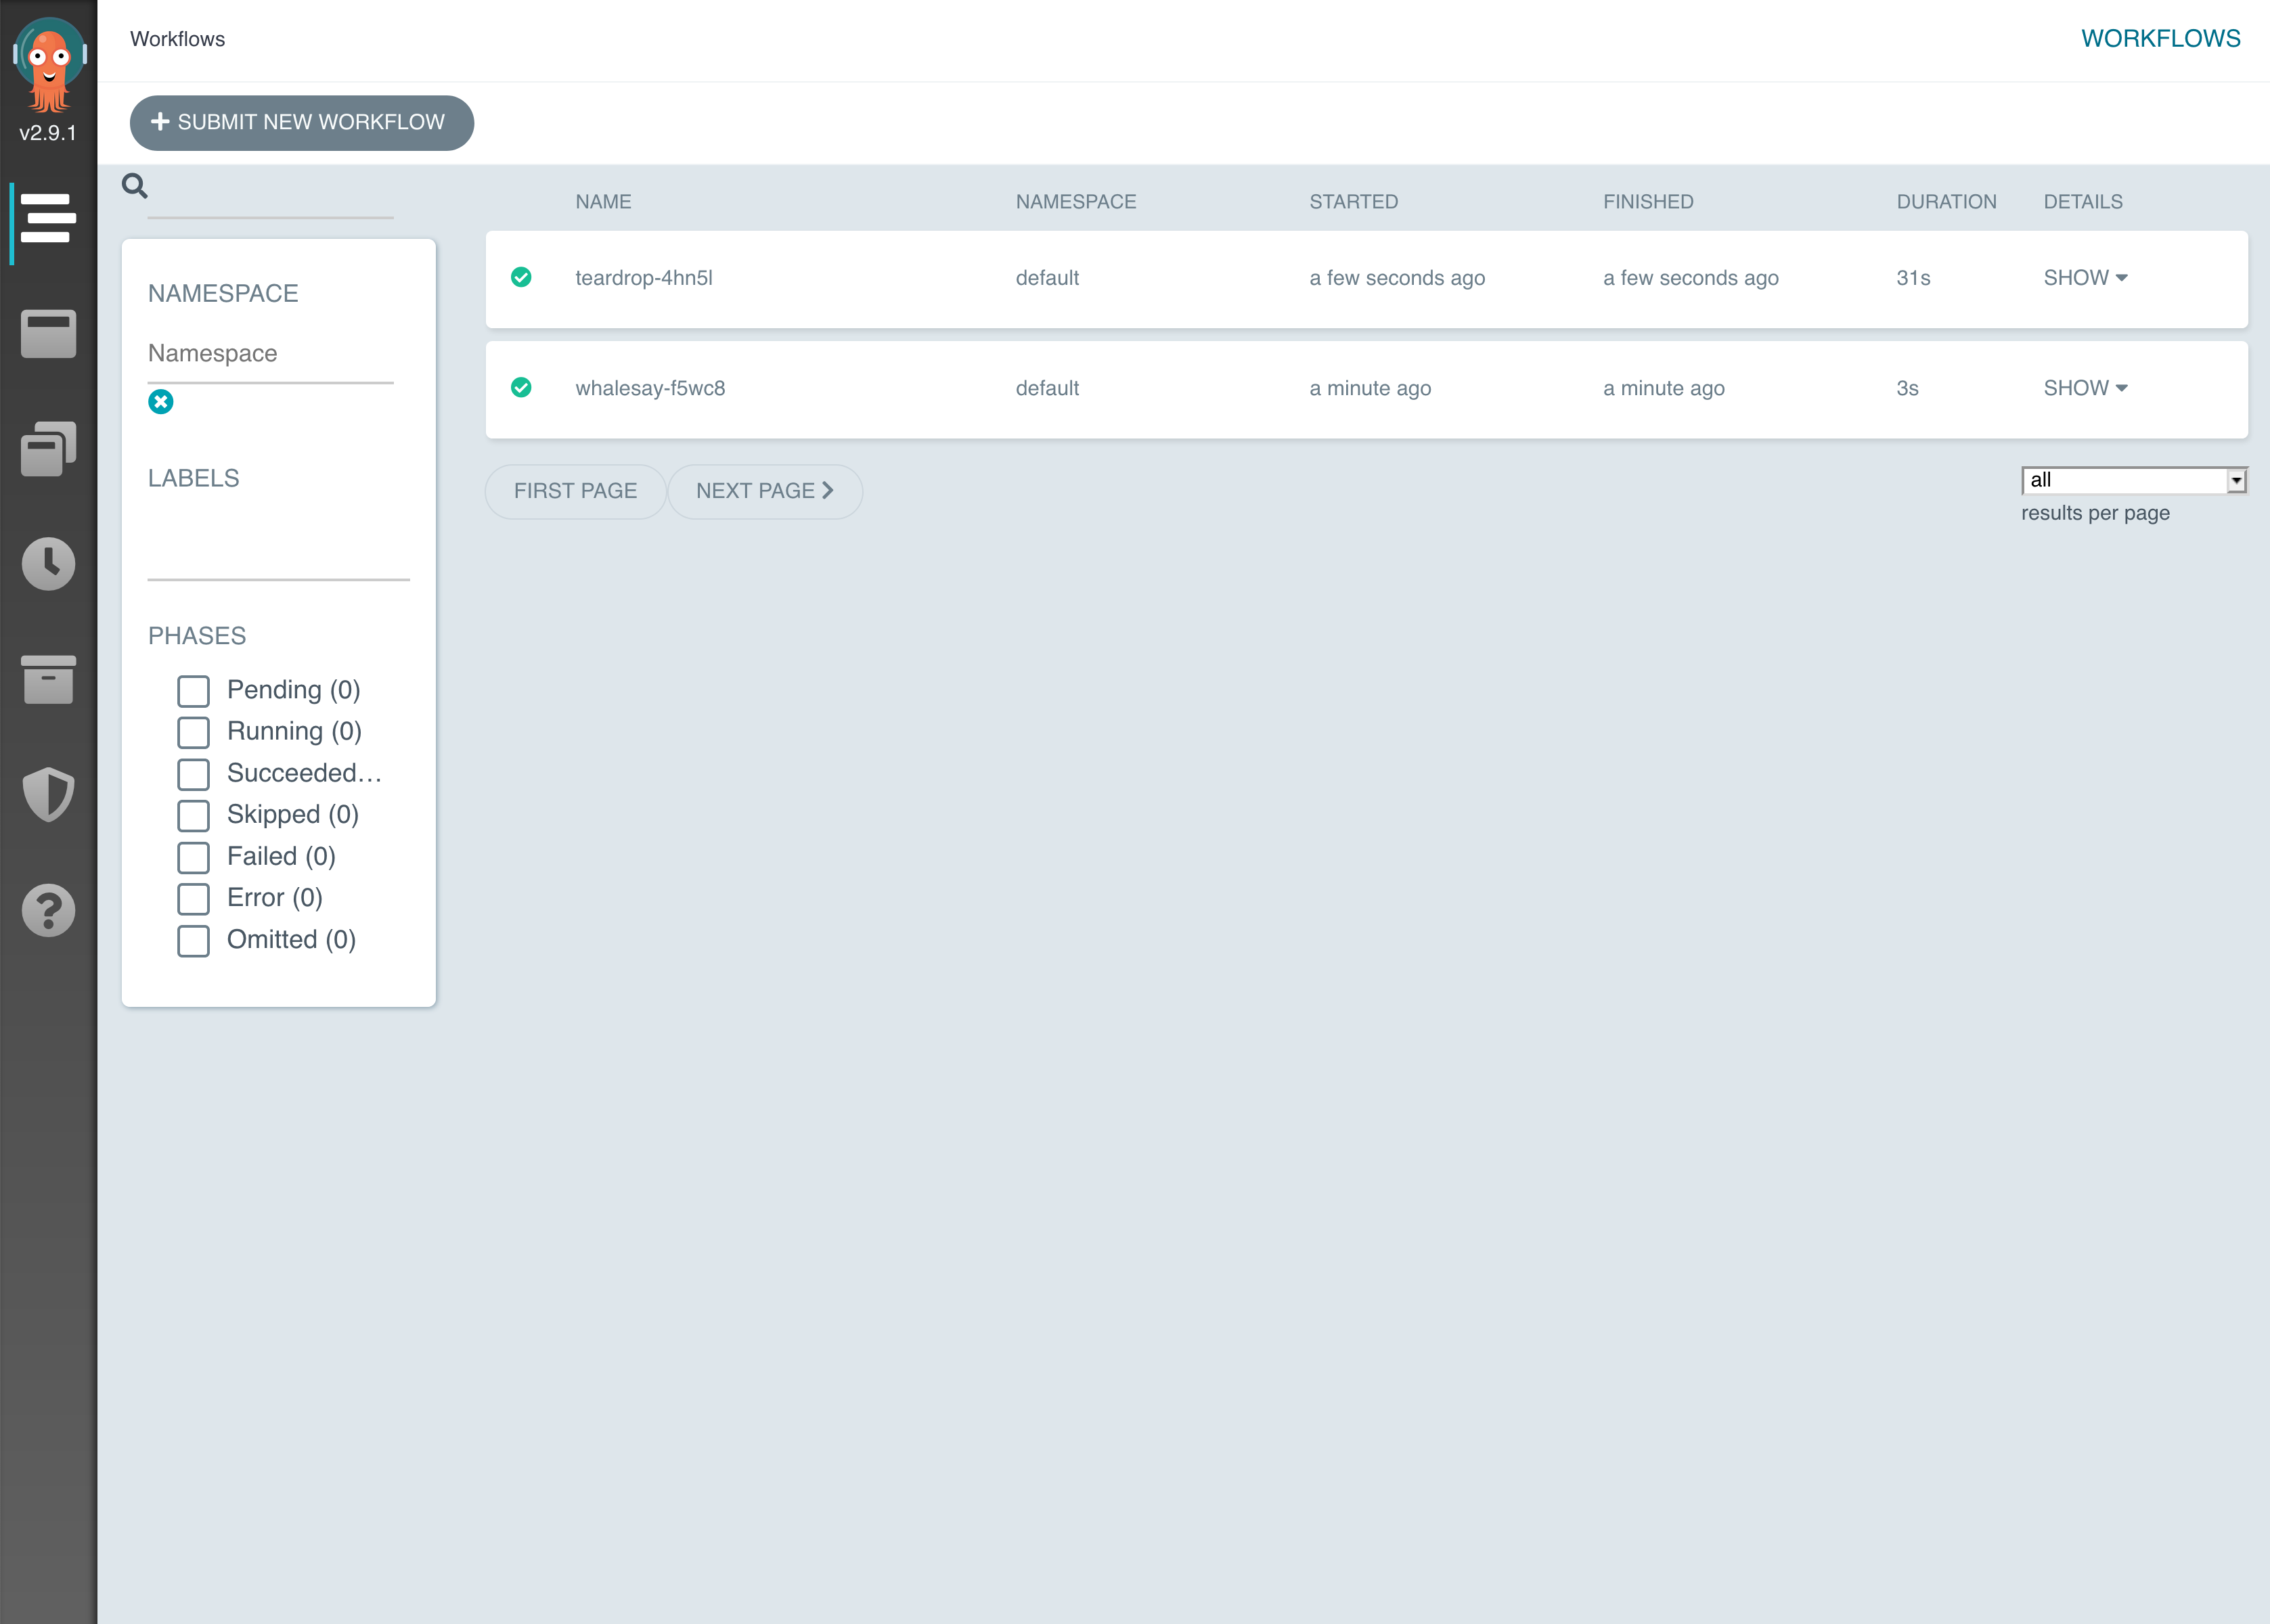
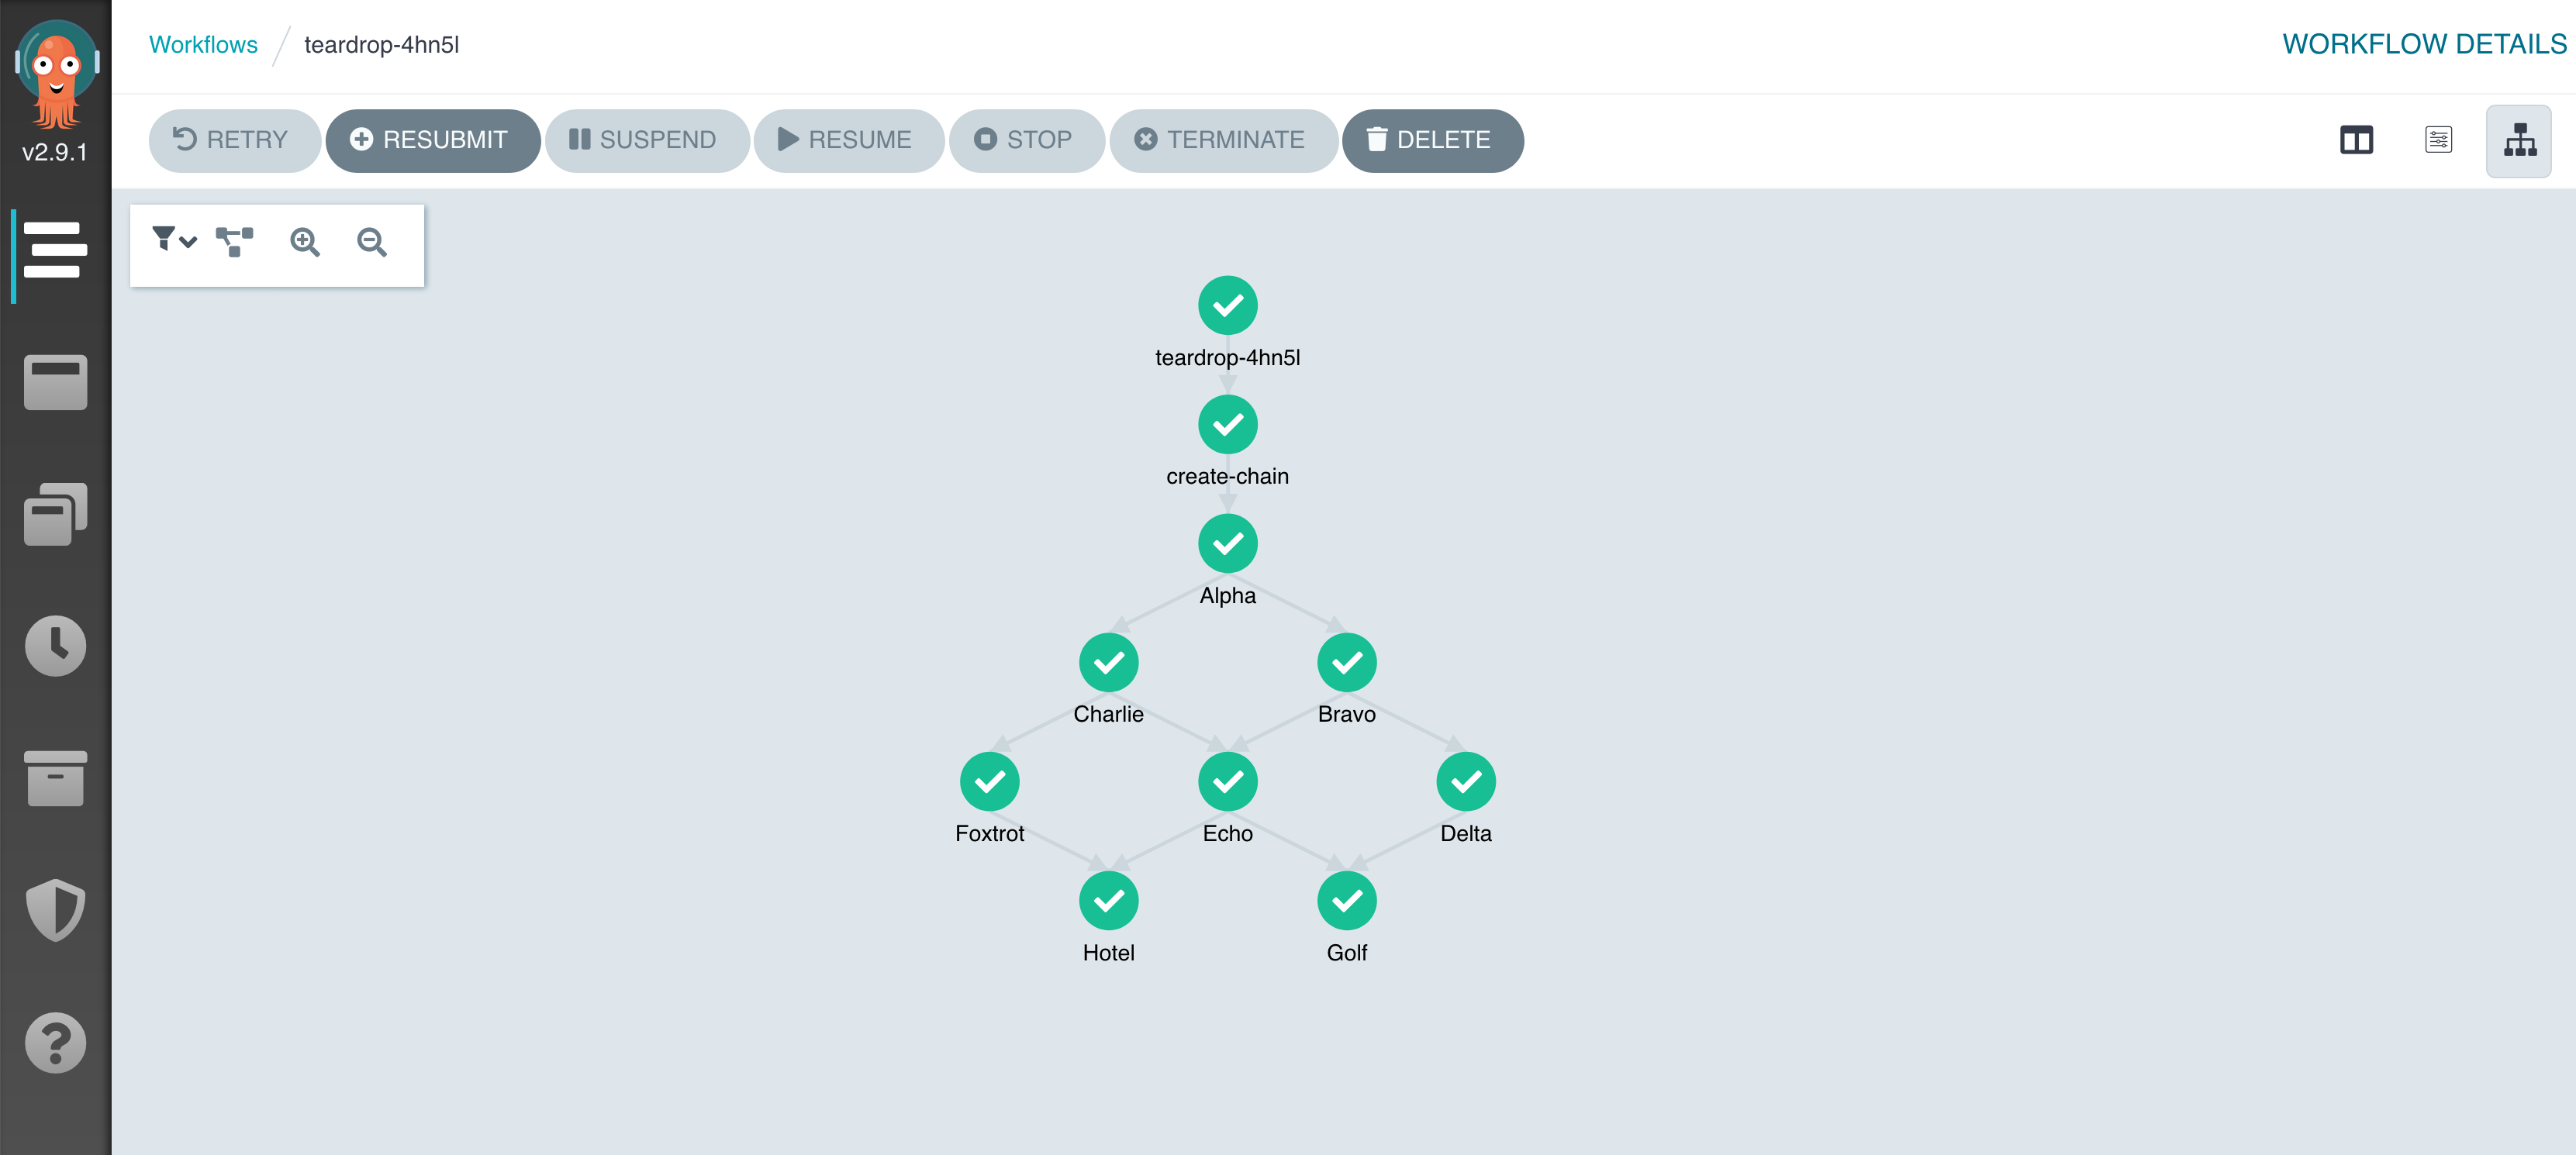
You will see the teardrop workflow from Advanced Batch Workflow. Click on it to see a visualization of the workflow.

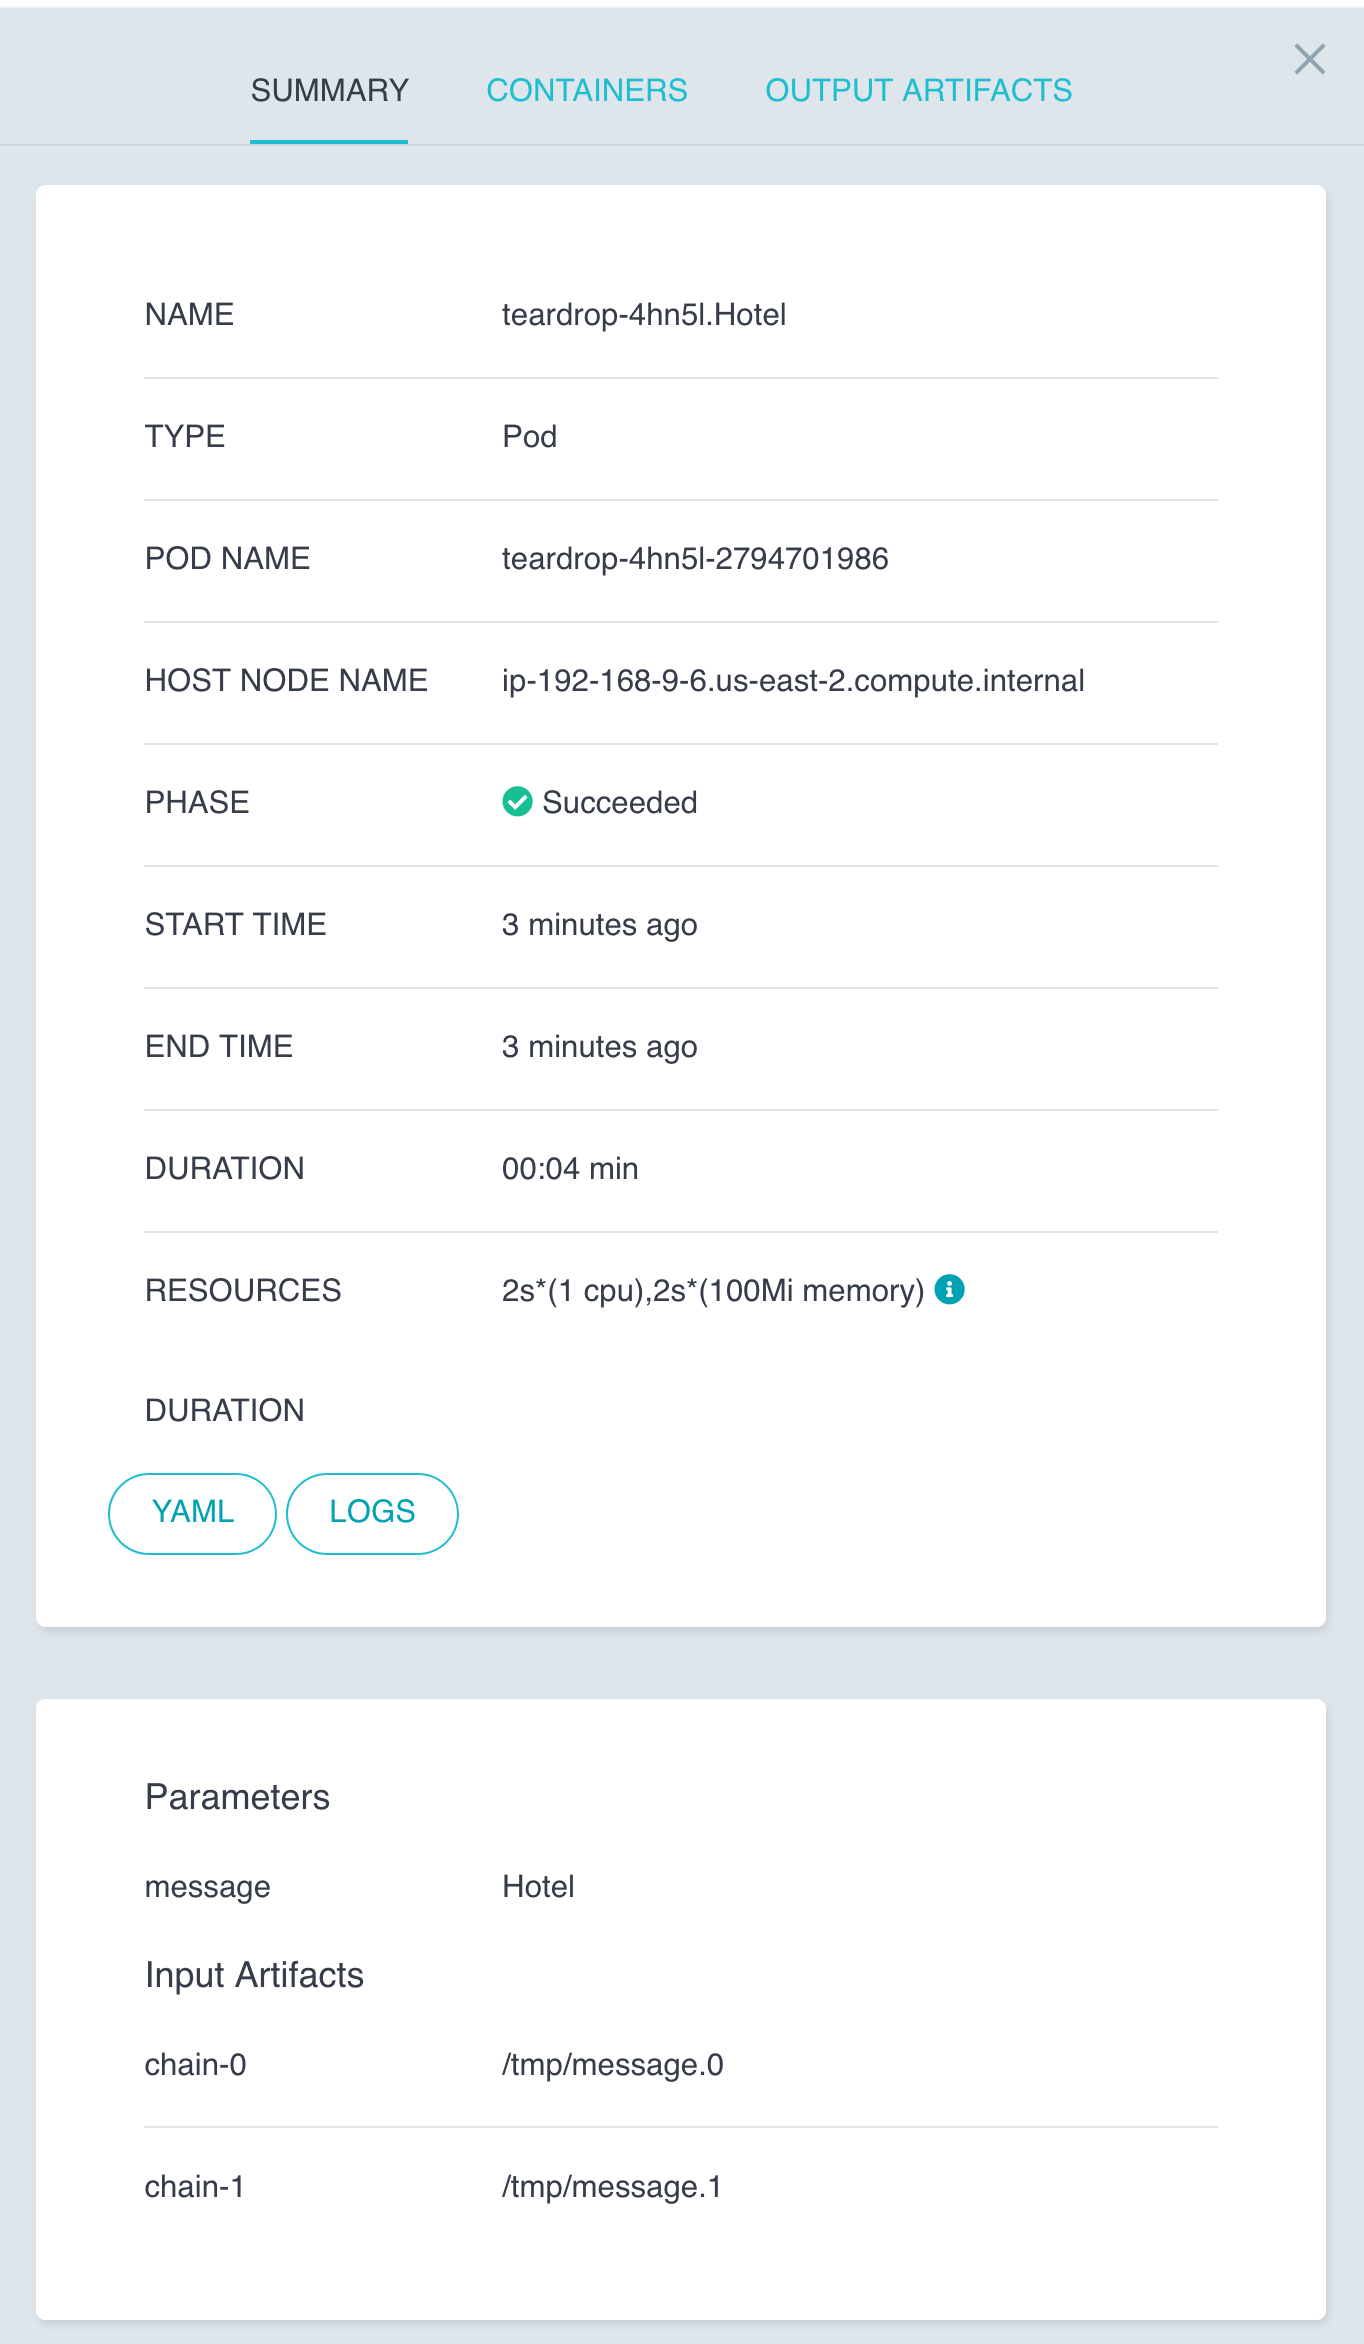
The workflow should relatively look like a teardrop, and provide a live status for each job. Click on Hotel to see a summary of the Hotel job.

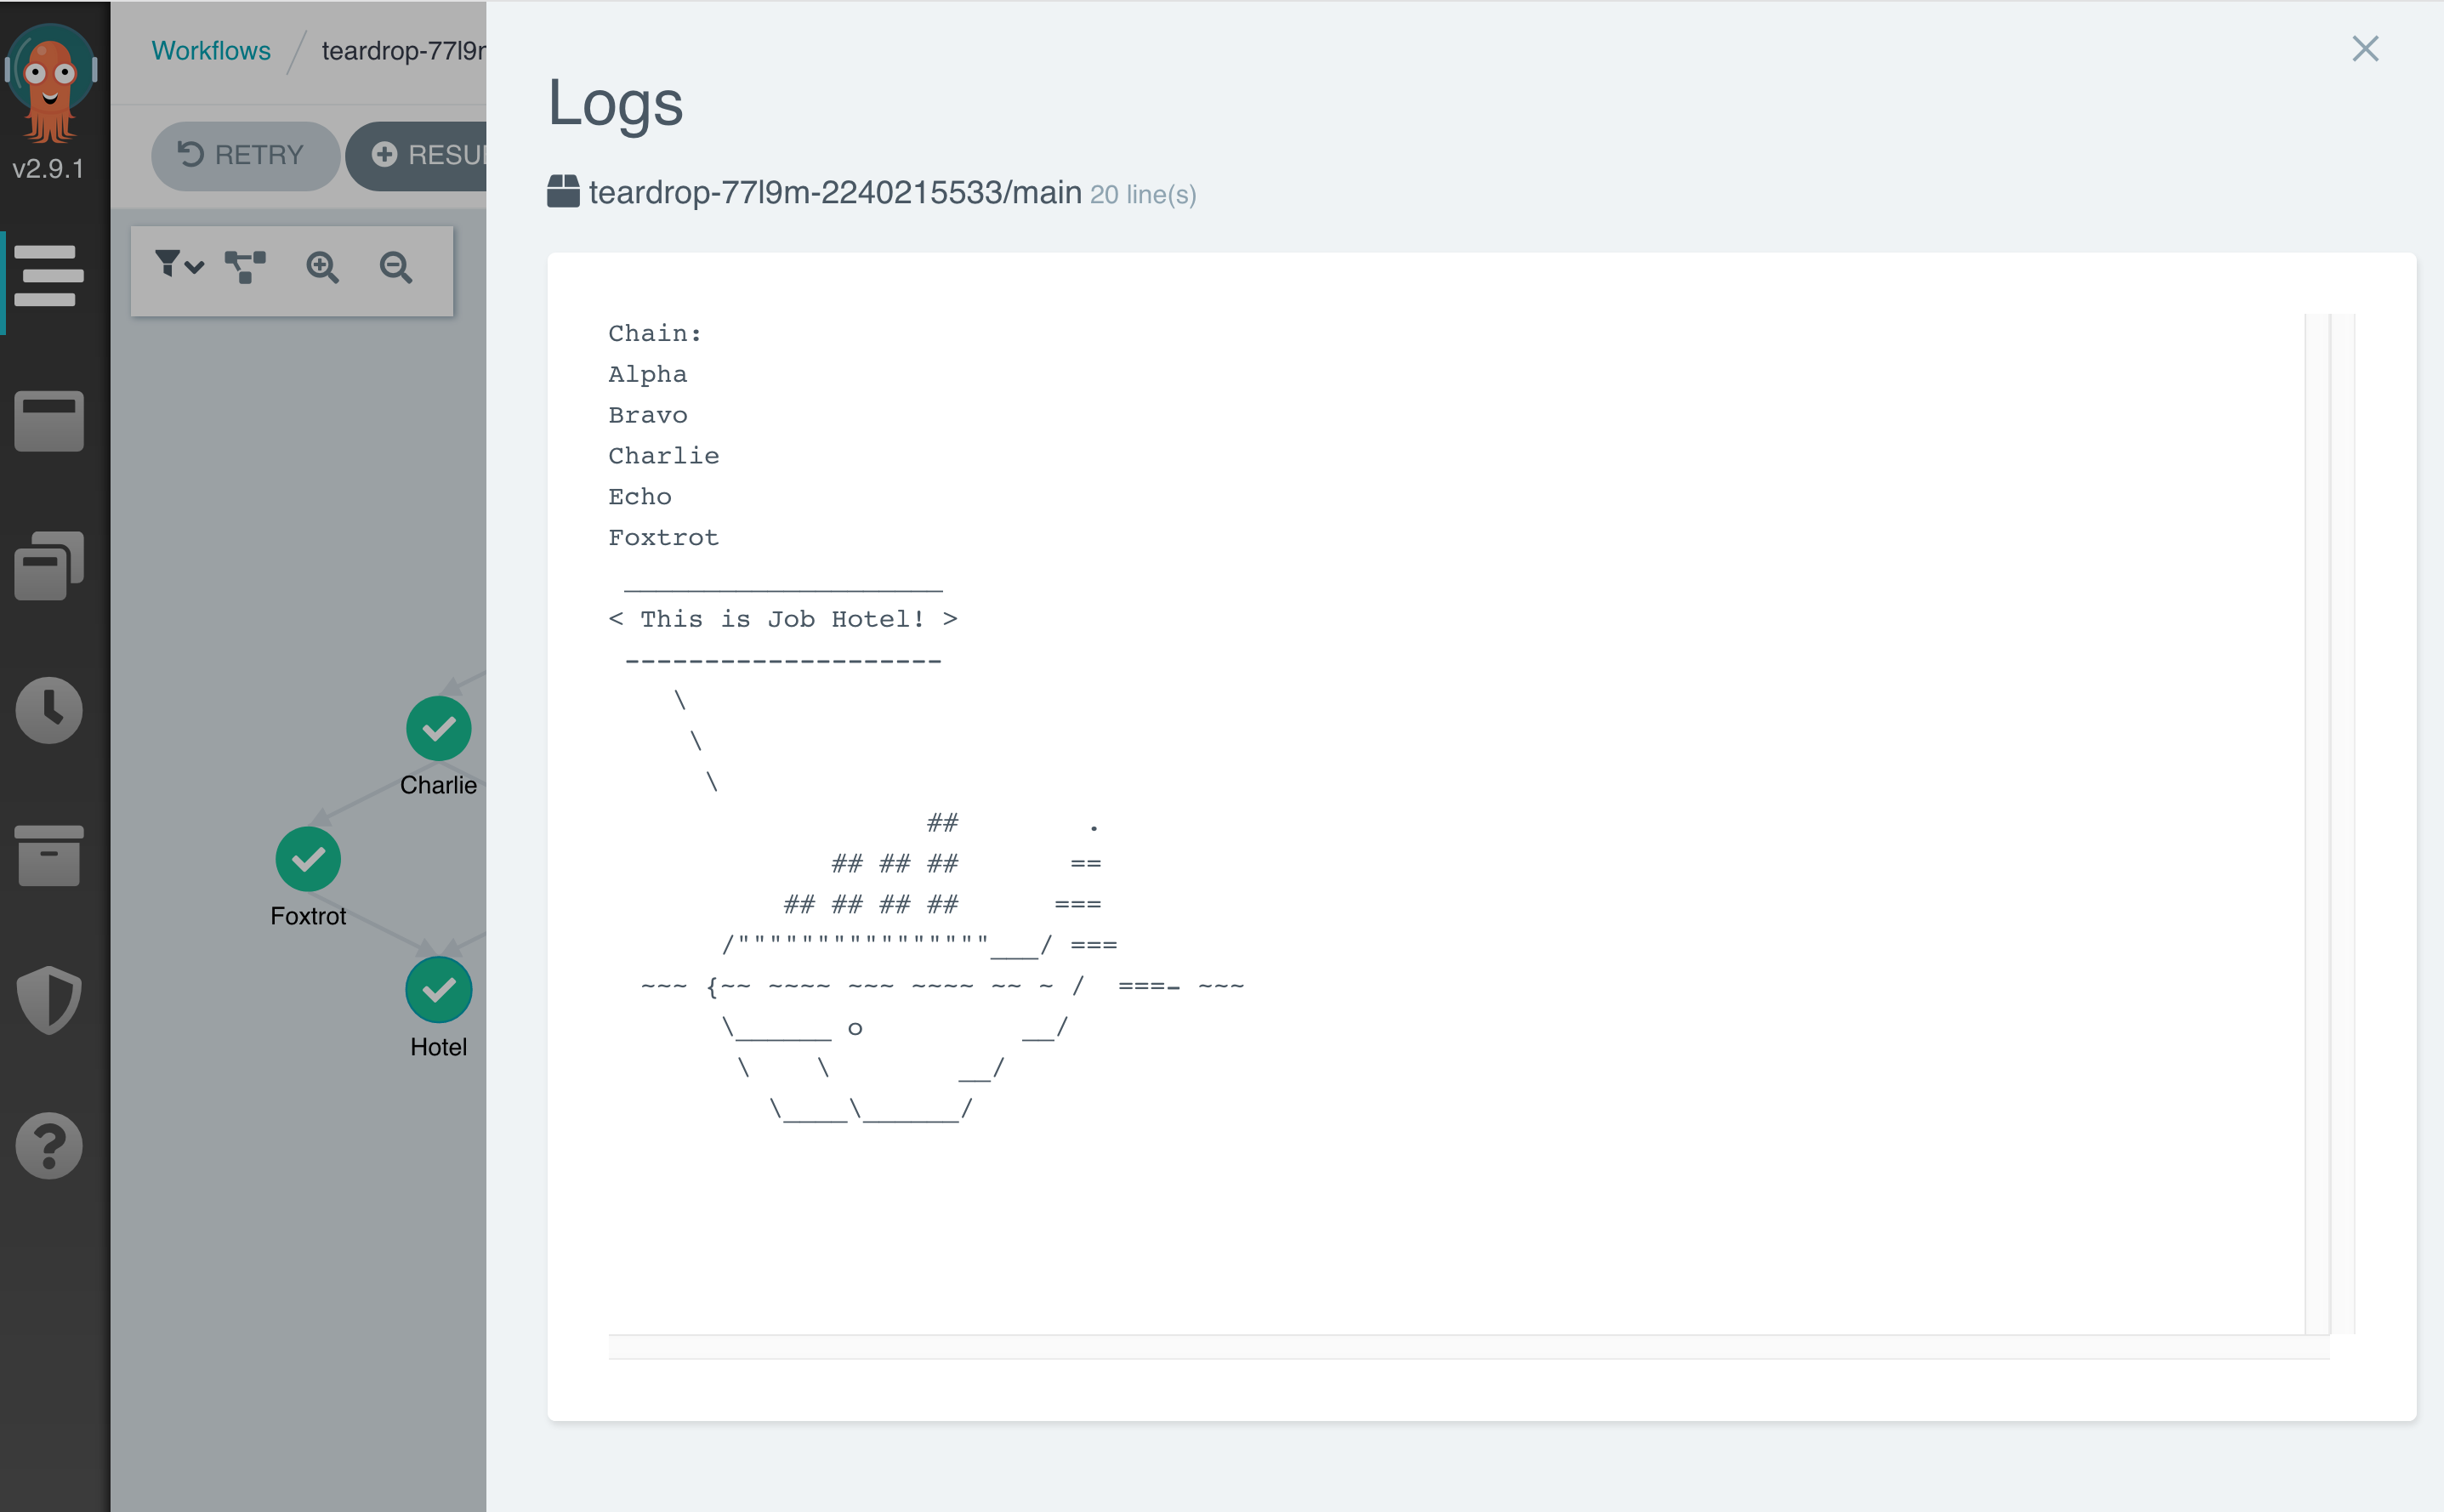
This details basic information about the job, and includes a link to the Logs. The Hotel job logs list the job dependency chain and the current whalesay, and should look similar to:

Explore the other jobs in the workflow to see each job’s status and logs.