Amazon EKS Workshop > Advanced > EMR on EKS > Monitoring and logging Part 4 - Prometheus and Grafana
Monitoring and logging Part 4 - Prometheus and Grafana
You will need to have prometheus and grafana installed before you can proceed with this section.
You can follow the Prometheus and Grafana sections to get the steps to install both of these.
You can also use Amazon Managed Service for Prometheus and Amazon Managed Service for Grafana. In order to get started with these, follow the official docs for AMP and AMG.
Once you have Prometheus and Grafana installed, head over to Grafana, and import the dashboard 11674.
Now run the below job:
aws emr-containers start-job-run \
  --virtual-cluster-id=${VIRTUAL_CLUSTER_ID} \
  --name=pi-2 \
  --execution-role-arn=${EMR_ROLE_ARN} \
  --release-label=emr-6.2.0-latest \
  --job-driver='{
    "sparkSubmitJobDriver": {
      "entryPoint": "local:///usr/lib/spark/examples/src/main/python/pi.py",
      "sparkSubmitParameters": "--conf spark.executor.instances=2 --conf spark.executor.memory=2G --conf spark.executor.cores=2 --conf spark.driver.cores=1"
    }
  }'
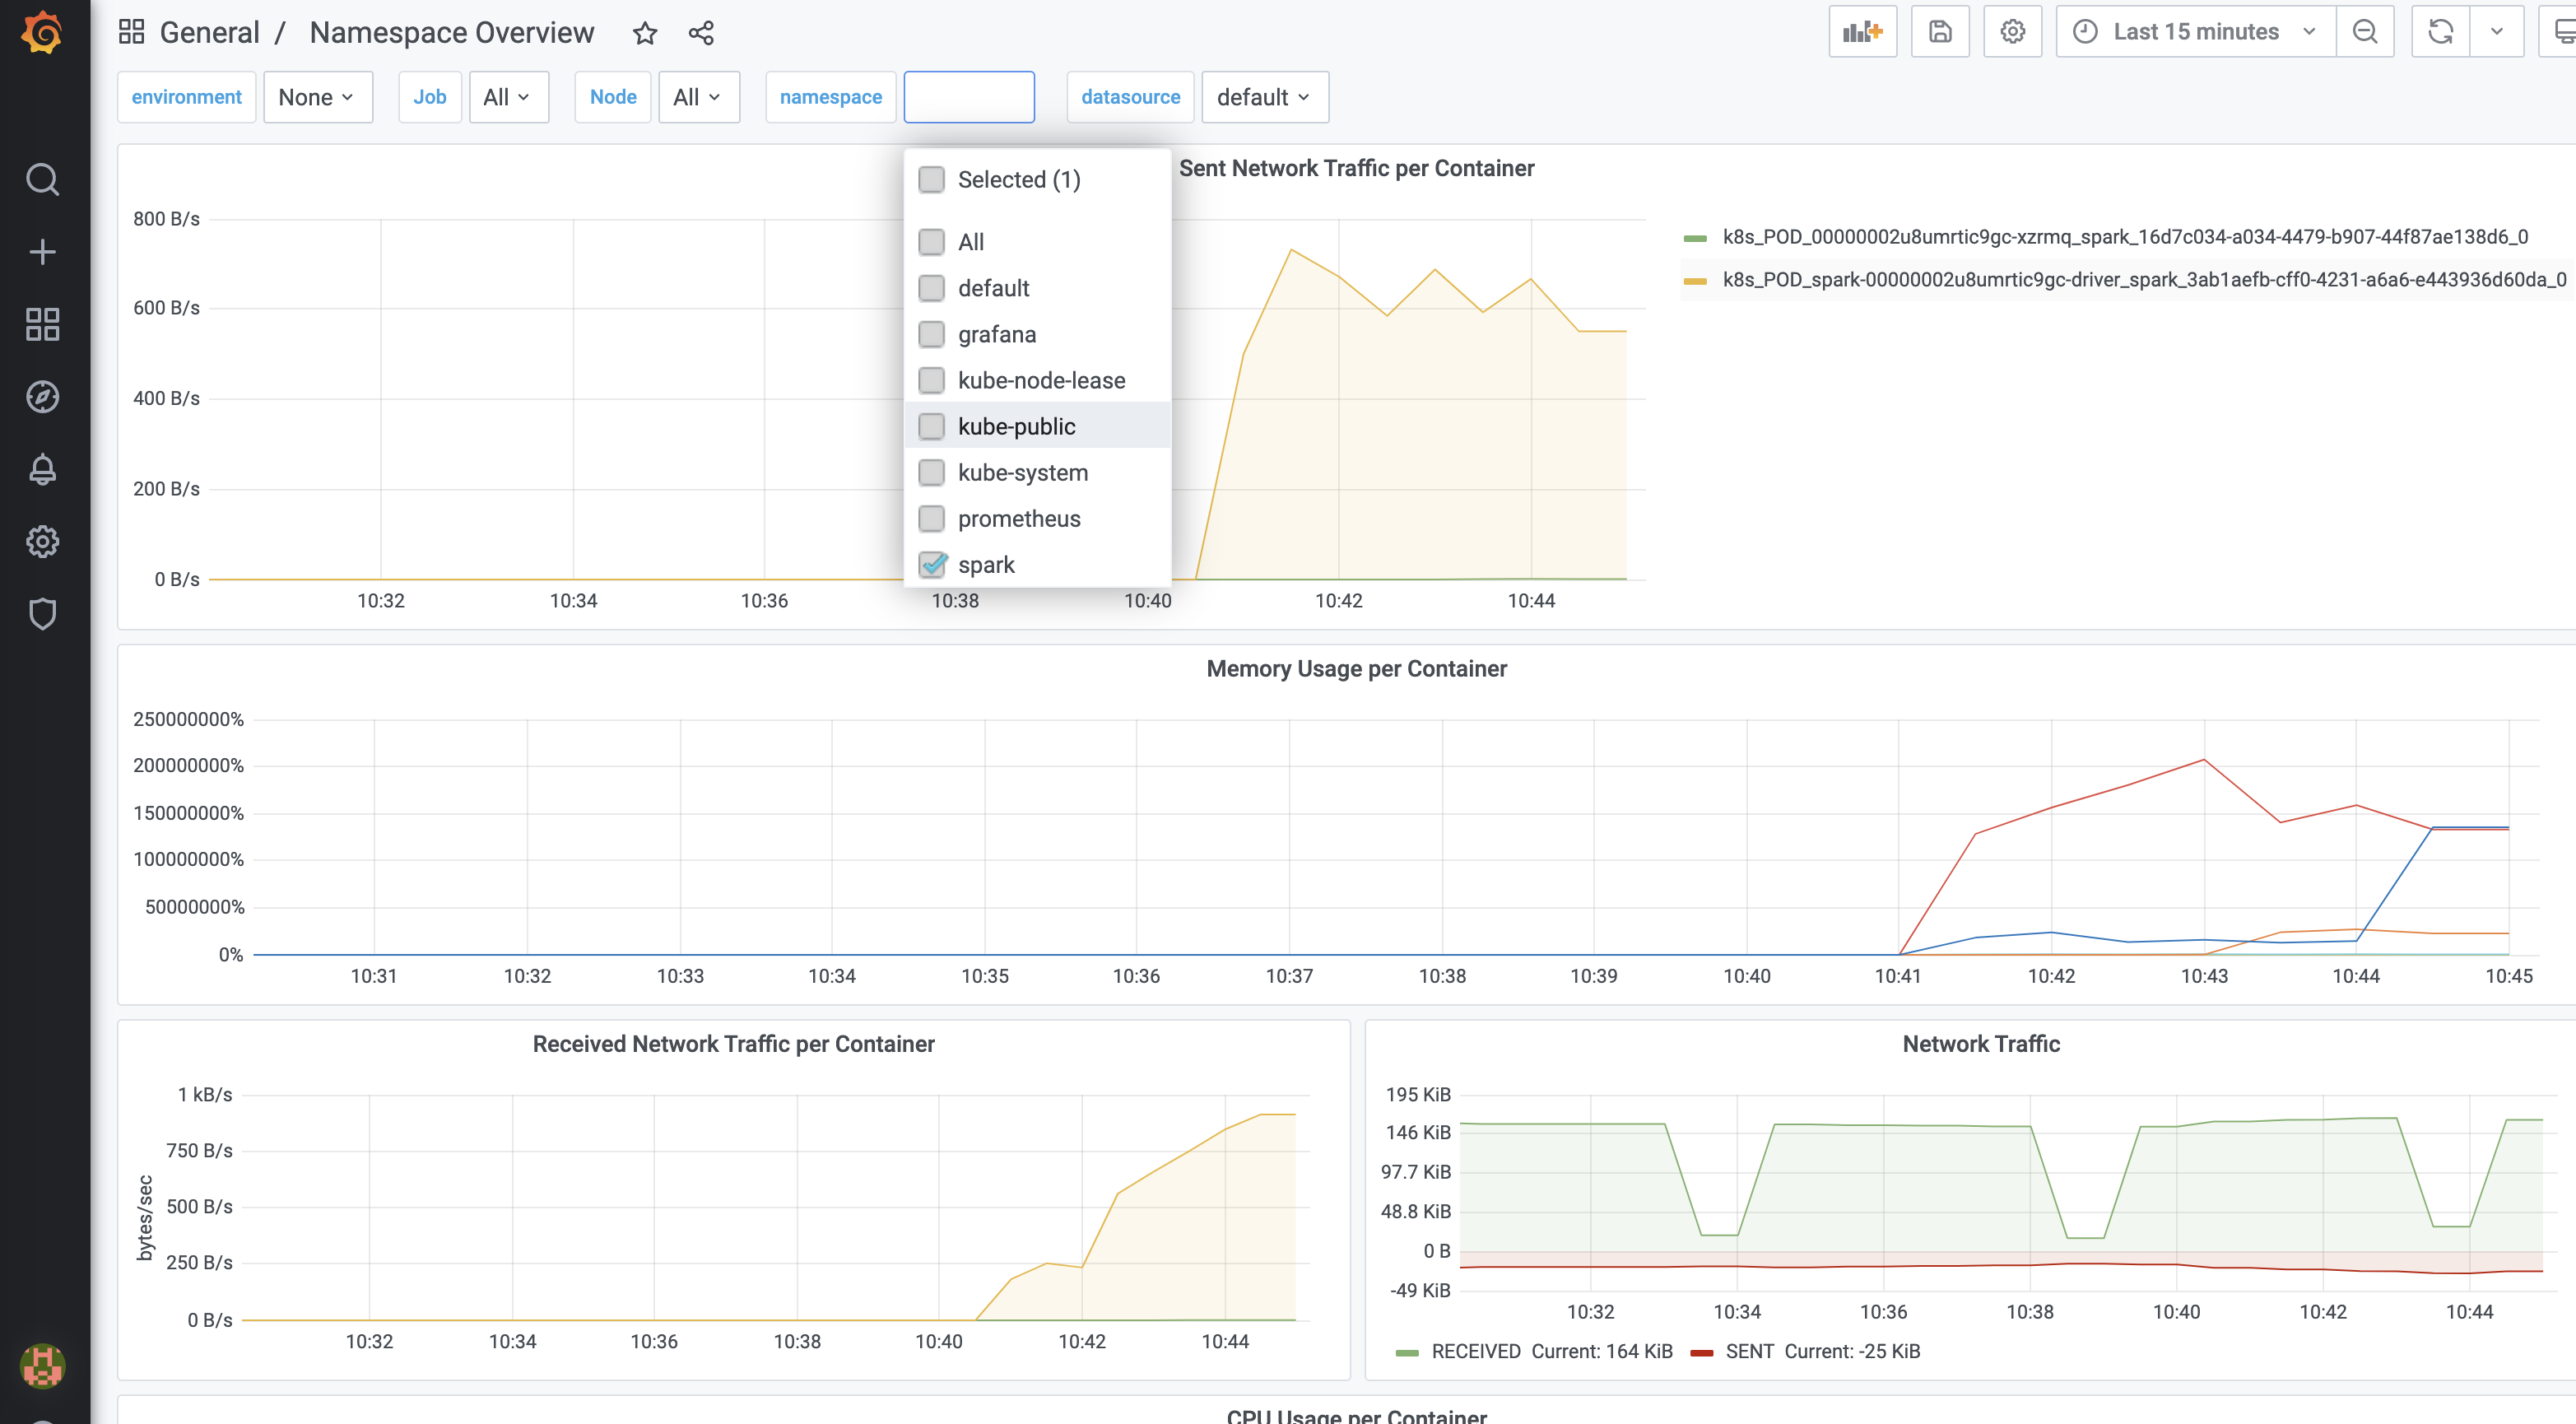
Once the job is started, head over to the dashboard and select the namespace spark as shown below.

You will be able to see the resource utilization by spark for running your job.