Policy Automation and External Access
Getting Started
Before you go any further, please remember to type lab1 set_up in the terminal to set up the environment for this lab.
Introduction
In this lab, you will learn to leverage Calico Enterprise to implement pod-level access controls and enable a self-service model that makes it easy for development teams to define and deploy Calico and Kubernetes network policies for their applications. This allows your organization to more easily adopt best practices around microsegmentation and a zero-trust approach to network security in your Kubernetes platform.
You will learn the following:
- How to use Policy Tiers and Network Sets to define network policies that define the “guard rails” for your entire Kubernetes platform
- How to use DNS policy rules to enable external access for applications in specific namespaces
- How to use the Flow Visualizer to gain visibility into existing traffic flows within the cluster and select workloads to recommend policies using Policy Recommendations
- How to use Policy Impact Preview and Staged Network Policies to evaluate the impact of new network policies and changes to existing policies before they are enforced within the cluster
Setup
For this lab, we will be using a fairly simple microservices application called storefront to walk through the implementation of Network Policy - both as someone from platform engineering and as a storefront application developer.
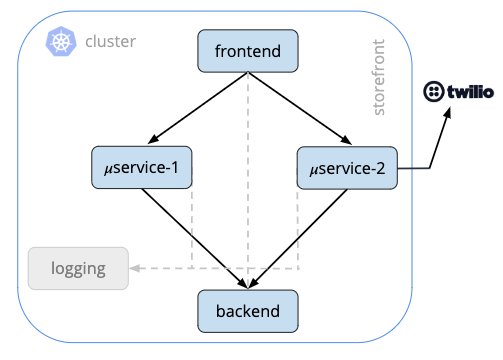
Storefront (Fig 1) is a fairly simple microservices application running in Kubernetes. It has a frontend service that handles end-user requests, communicates with two business logic services which in turn make requests to a backend service. All of these containers communicate with a logging service and one of the business logic services, microservice 2, makes external requests to Twilio to provide some telephony for this application.
Let’s quickly take a look at the pods running in the storefront namespace that are using to run these microservices:
kubectl get pods -n storefront

NAME                             READY   STATUS    RESTARTS   AGE
backend-6cfbdd589f-xxlkn         2/2     Running   0          22h
frontend-864f4fcdfd-2hhv4        4/4     Running   0          22h
logging-684747d7cd-bbjwx         1/1     Running   0          22h
microservice1-794cf77b9d-c27qr   4/4     Running   0          22h
microservice2-7bb79d9f4f-f7h6f   5/5     Running   0          22h
Using the Flow Visualizer
Next, let’s login to the Calico Enterprise UI and use the Flow Visualizer to understand how these services are communicating with each other. Login to Calico Enterprise and select the Flow Visualizations from the left navigation menu
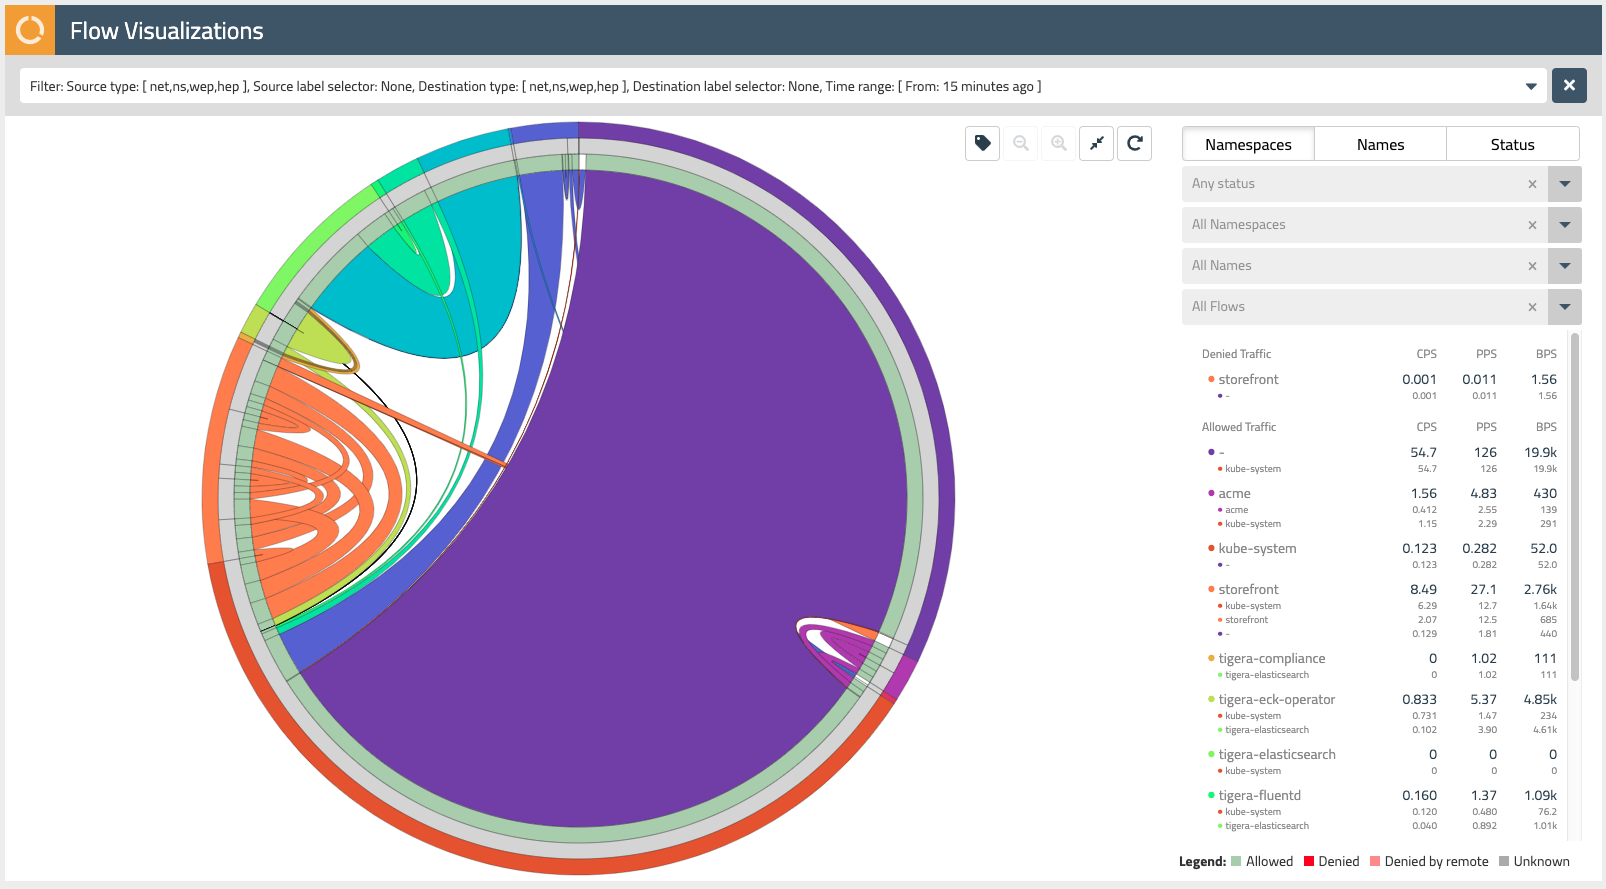
The Flow Visualizer is a powerful tool to gain visibility into network traffic within the cluster and troubleshoot issues. Later in this lab, we will also use it to recommend network policies for our storefront application.
The outer ring of the Flow Visualizer can be used to select the various namespaces within our cluster. Mousing over each subsection, you’ll see the name of the namespace appear in the dropdown filters on the right-hand side.
Find the storefront namespace and select it, then use the magnifying glass button in the upper right to zoom in on these network flows.
Mousing over subsections of the next inner ring (grey), you will see the pod prefixes for each of the microservices that make up our storefront application. Note that Calico Enterprise aggregates network flows so it is easy to make sense of traffic in your cluster that may be backed by Kubernetes resources like replica sets.
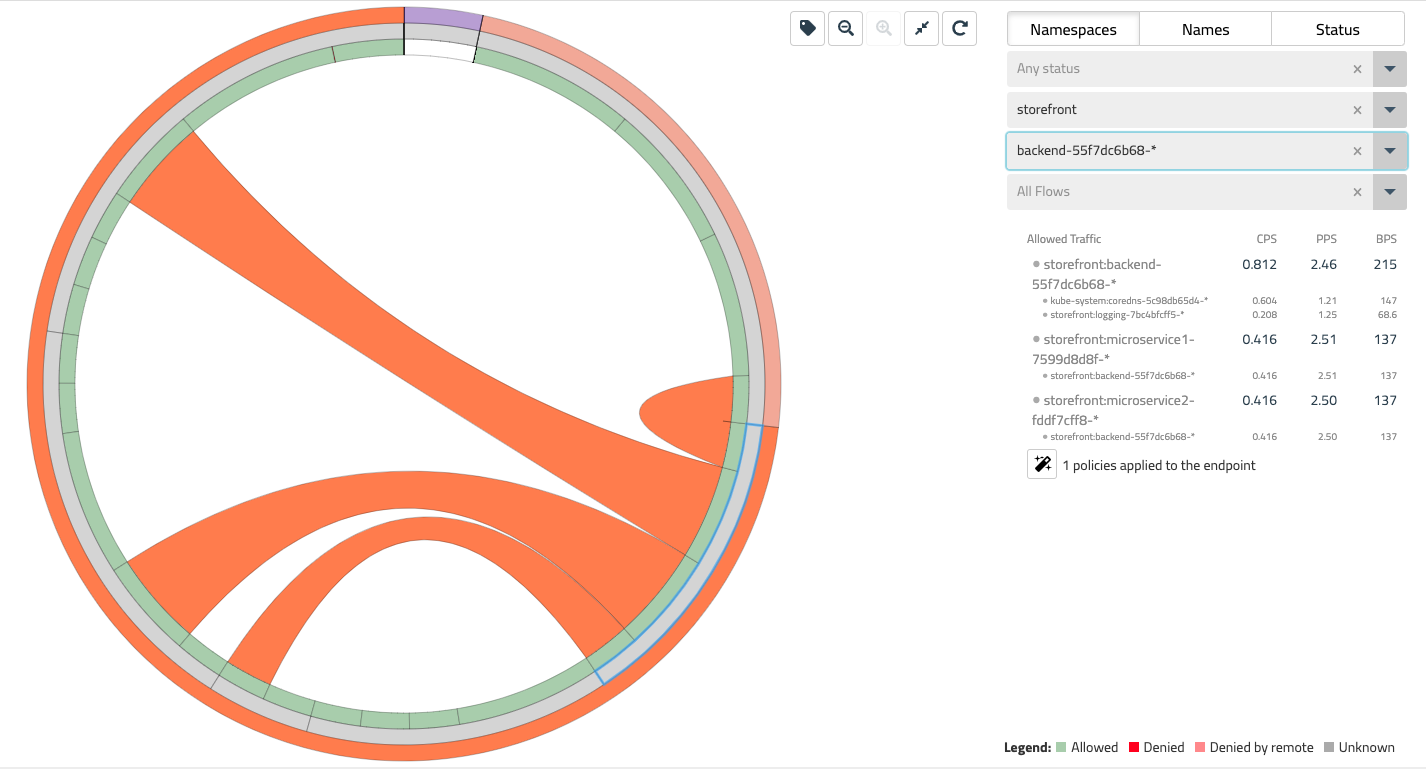
The innermost ring in the Flow Visualizer allows you to select specific network flows that are associated with each of our storefront microservices. Mousing over each subsection, you will see each of these flows on the right-hand side dropdown - these should correspond to the diagram at the beginning of this lab (Fig 1).
Understanding Policy Tiers
Now that we have a better understanding of the microservices that make up our storefront application and how they are communicating with each other, let’s assume the role of someone from platform engineering to start defining network policies for our cluster.
Calico Enterprise makes it easy to define the “guard rails” for your Kubernetes platform through the use of Policy Tiers. Policy Tiers allow platform engineering and security teams to enforce network policies that take precedence over those defined for specific applications like storefront.
Login to the Calico Enterprise UI and select Policies from the left navigation menu. Here you will see all of the network policies defined within the cluster and how they map to policy tiers.

Tiers are evaluated from left to right, and network policies within tiers are evaluated from top to bottom. This effectively means that a network policy in the Security tier (Fig. 4) needs to evaluate and pass traffic before any policy below it or to the right can see that same traffic. Tiers are tied to RBAC and provide a powerful way to implement security and platform controls for your entire cluster without having to involve application teams. Your lab environment already has a few policies in the Platform and Security tiers that provide some examples of some common use cases.
Enabling access to Twilio APIs
Putting on our platform engineering hat, let’s use policy tiers to define a network policy that will be used to control traffic leaving our cluster - in this case, applications like storefront that need access to the Twilio APIs.
On the Policies Board, click the +ADD POLICY link in our platform tier. Let’s call this policy “twilio-integration”, add it after global.logging, and make the scope of the policy Global.
By default, a GlobalNetworkPolicy applies to the entire cluster. In this case, we want to enable specific namespaces (i.e. different applications) to access the Twilio APIs. Add a namespace selector with a key of “twilio” and a value of “allowed.” This policy will only apply to namespaces that have been granted permission to access Twilio with this label - the storefront namespace already has this label.
Under Type, select the Egress rule checkbox and deselect the Ingress checkbox. Now let’s add an Allow egress rule that will whitelist traffic to the Twilio API endpoint. Here we can leverage DNS rules with a wildcard match to ensure that applications will not break if the subdomain for the endpoint changes.
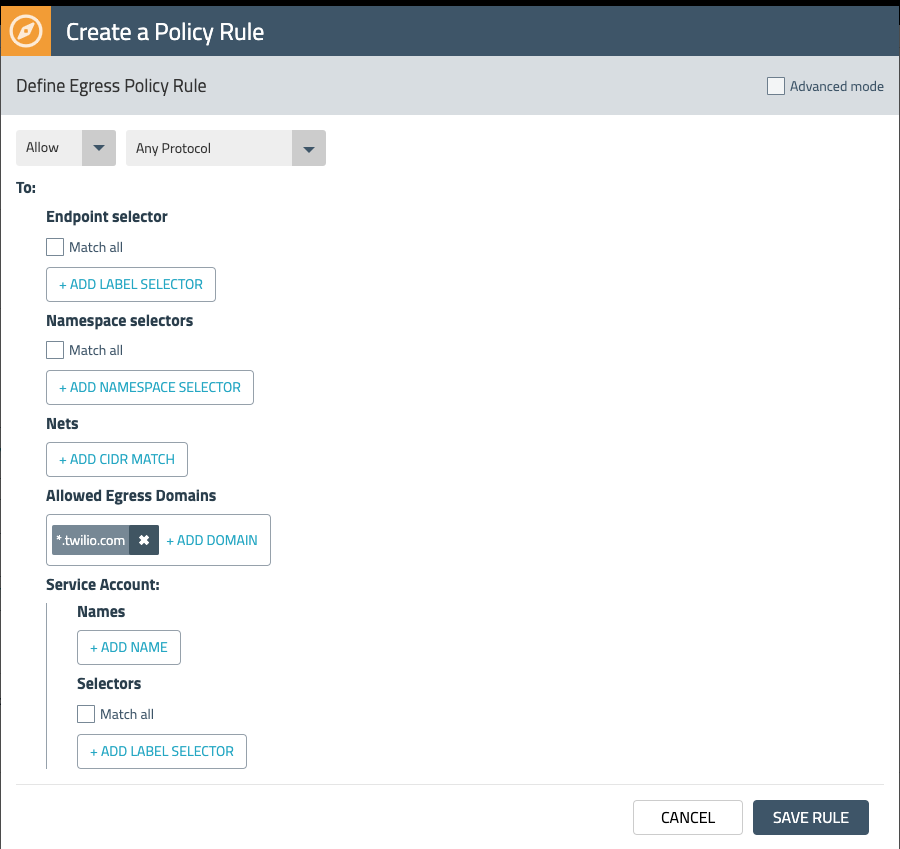
While this egress rule allows traffic to *.twilio.com, we also want to restrict any other egress traffic that is leaving the cluster. We can accomplish this by adding another egress Deny rule that makes use of a Network Set.
Network Sets allow you to create long lists of CIDRs, IPs, or domains and abstract them with a label that can be referenced in network policies. The lab setup has an existing Network Set for all public IP CIDRs. Add it to the egress Deny rule by using the label “type=public” as shown in Fig. 6 below.
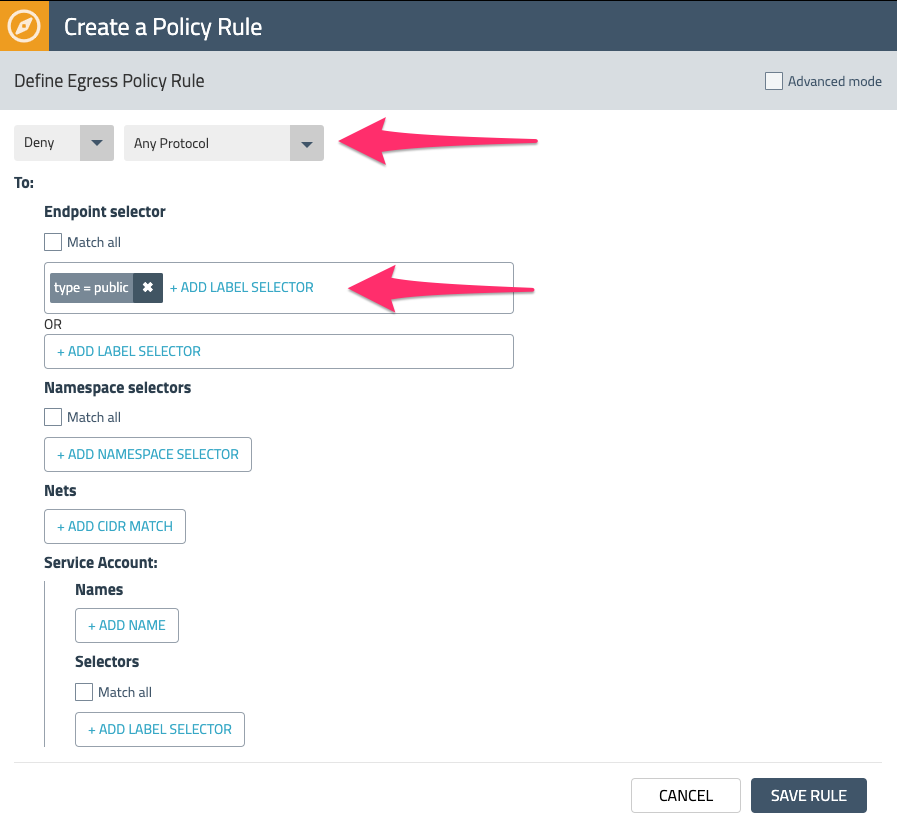
Save and deploy the policy by selecting Enforce. Check out some of the other Network Sets that are available in the lab environment by choosing Network Sets from the left navigation menu.
Generating policies for storefront
Now that we have defined a policy to enable external access for our k8s platform, let’s put on our application developer hat and begin to define policies that whitelist only what is required by our storefront application - i.e. a zero-trust and least privileged approach to network security.
While application developers are often familiar with Kubernetes, they may not have the domain expertise to define their own k8s or Calico network policies. Policy Recommendations is a key capability of Calico Enterprise that makes this process easier by automatically generating policies for specific workloads based on their labels and associated network flows.
Return to the Flow Visualizer and select the storefront namespace and zoom in on this view. As you mouse over the pod prefixes, notice the “magic wand” icon on the right - this can be used to generate policy recommendations.
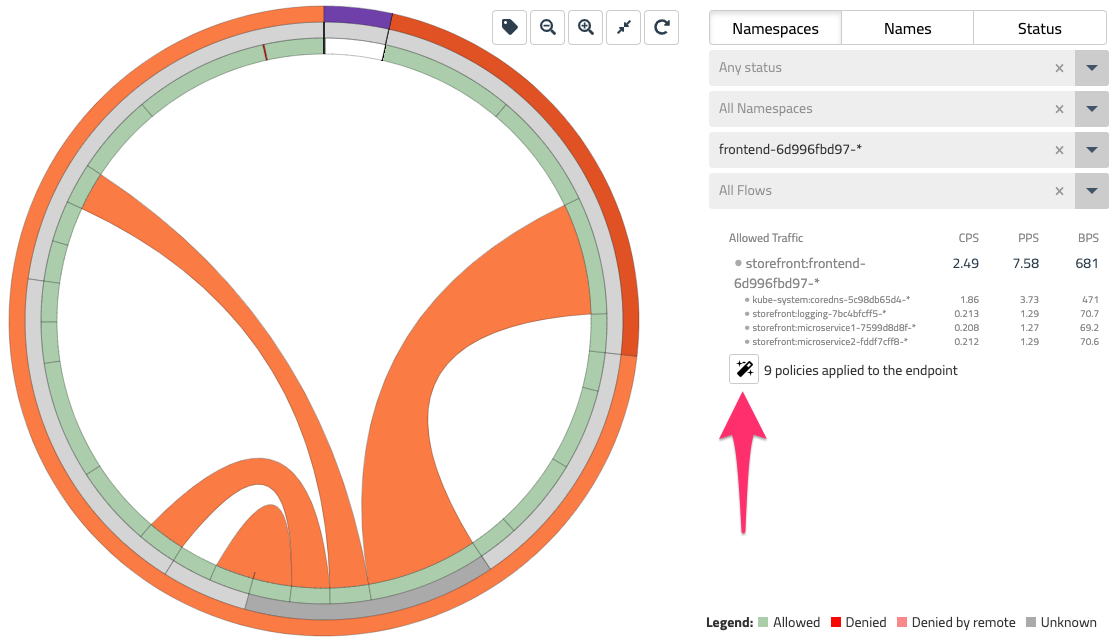
Select the frontend-* pod prefix and click the magic wand to generate a network policy for this workload. This will bring you to a Staged Network Policy that has been recommended by looking at the labels and network flows for frontend.
We will cover Staged Network Policies in the next section, but for now, go ahead and select STAGE for our frontend policy and repeat this process for microservice1, microservice2, and backend.
Previewing and staging policy changes
In the last section, we generated network policies for our storefront application using Policy Recommendations. The output of this process was a set of Staged Network Policies. Staged policies are a Calico Enterprise resource that lets you evaluate the impact of your network policies before going to production. Specifically, you can verify that correct flows are being allowed or denied. Let’s do this for the storefront policies we just generated.
Verify there are some staged policies for storefront:
kubectl get stagednetworkpolicies.projectcalico.org -n storefront

NAME                              CREATED AT
default.backend-55f7dc6b68        2020-01-10T01:08:09Z
default.frontend-6d996fbd97       2020-01-10T01:05:46Z
default.microservice1-7599d8d8f   2020-01-10T01:09:25Z
default.microservice2-fddf7cff8   2020-01-10T01:10:11Z
Note: Even though we have been making heavy use of the Calico Enterprise UI, most of the features in Calico Enterprise are available via an API/command-line to make it easy to integrate these workflows into your CI/CD pipeline.
Let’s go back to the Policies Board - you should be able to see the set of staged policies that were listed in the last kubectl command. There is a toggle in the top-level filter to hide or show these policies.
In the upper right corner of the Policies Board, find the menu “Toggle stats” icon and check all of the boxes. Now you should have a birds-eye view of how traffic is flowing across tiers and policies - including the ones you have staged. The stats show you that traffic would be allowed by each of these staged policies if and when they are enforced. Along with the Flow Visualizer, the Policies Board is another valuable tool to quickly make sense of traffic within your cluster.
Policy impact preview
Before we wrap things up, let’s take a look at another tool in the Calico Enterprise toolbox - Policy Impact Preview. While staged policies allow you to evaluate network policies over a longer period of time, policy impact preview provides a quick sanity check on any change to an existing policy using historical traffic flows.
Going back to the default tier, open up the staged policy you just created with the storefront.default.backend prefix and select EDIT. We’ll do something reckless and delete the Egress rule. Now in the upper right select PREVIEW.
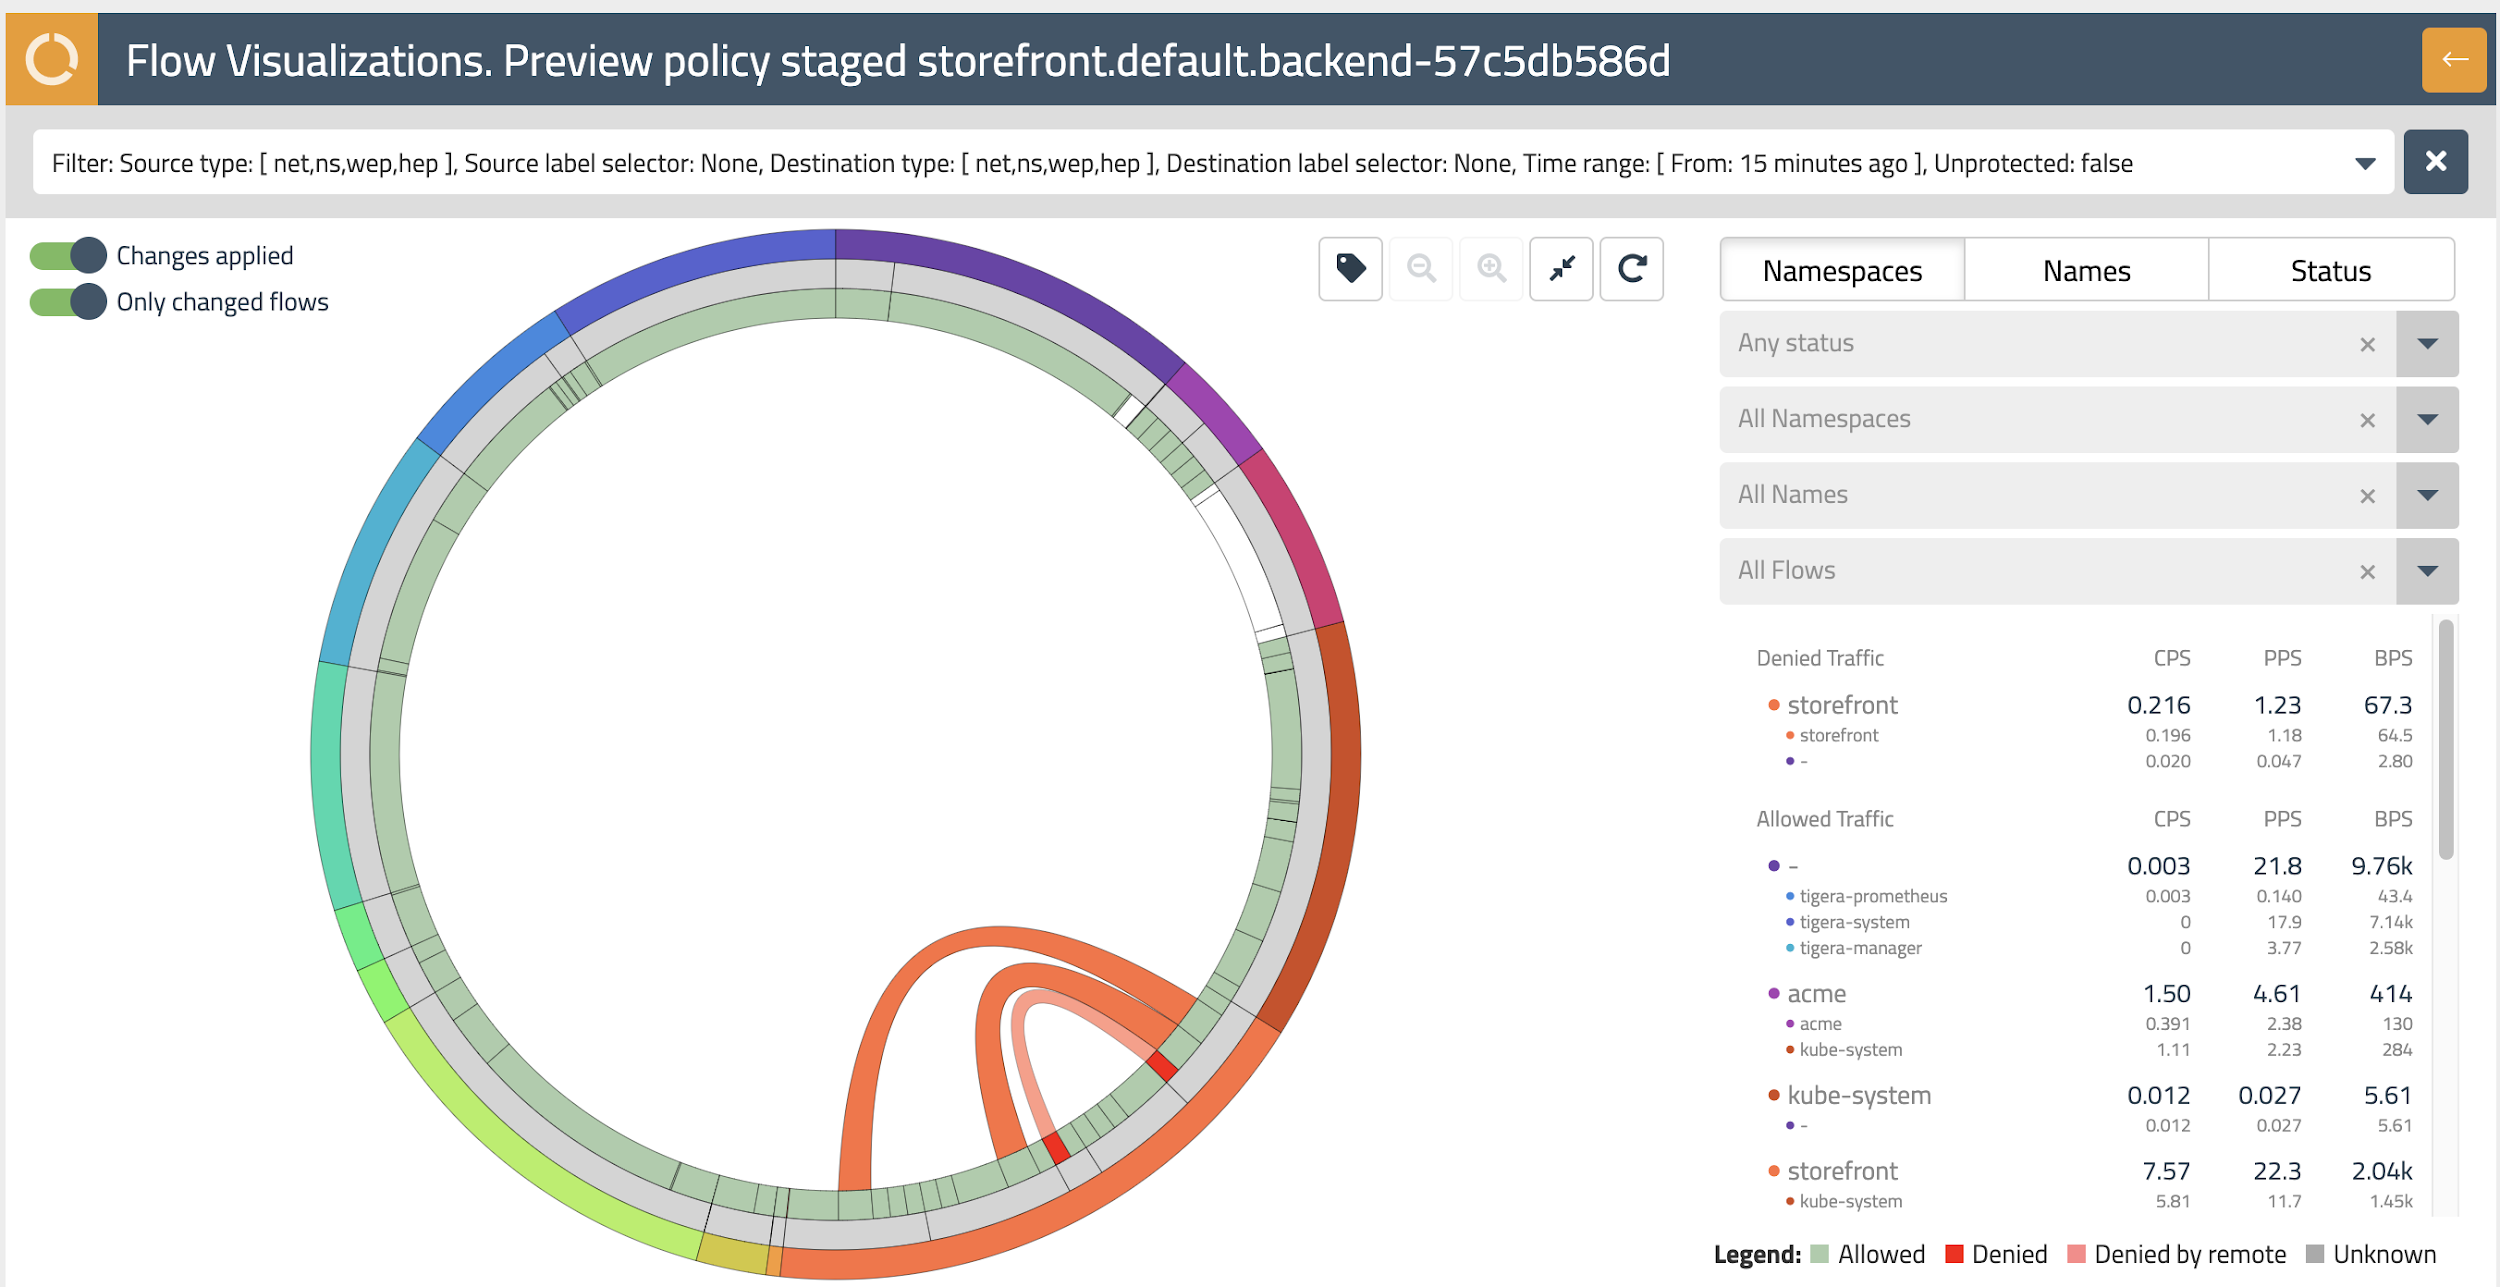
Hello again, Flow Visualizer! This time the flow visualizer is highlighting the flows that would be impacted with the policy change we just made - this is indicated by any flows flashing red. Mouse over this flow to see the details on the right-hand side.
Hitting the back arrow in the upper right takes you back to the storefront.default.backend policy, where you can cancel this edit.
Wrapping up
As someone from platform engineering, you should have a better understanding of the basics of policy tiers to stand up guard rails and external access for application teams. And as a developer, you learned how Calico Enterprise can help jump start efforts to implement microsegmentation of east-west traffic with policy recommendations specific to your application. Along the way you also touched on some of the visibility and analytics that Calico Enterprise provides.
Stick around and feel free to explore Calico Enterprise in your lab setup.