Dashboards
Log in to Grafana
Log in to Grafana dashboard using credentials supplied during configuration.
You will notice that ‘Install Grafana’ & ‘create your first data source’ are already completed. We will import community created dashboard for this tutorial.
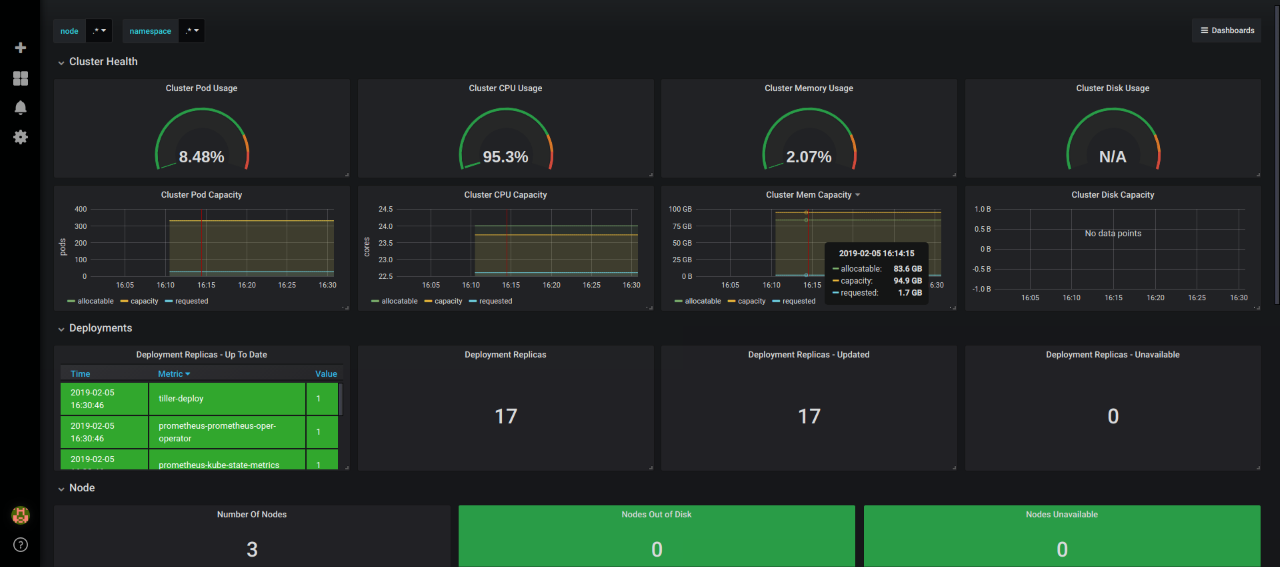
Cluster Monitoring Dashboard
For creating a dashboard to monitor the cluster:
- Click '+' button on left panel and select ‘Import’.
- Enter 3119 dashboard id under Grafana.com Dashboard.
- Click ‘Load’.
- Select ‘Prometheus’ as the endpoint under prometheus data sources drop down.
- Click ‘Import’.
This will show monitoring dashboard for all cluster nodes
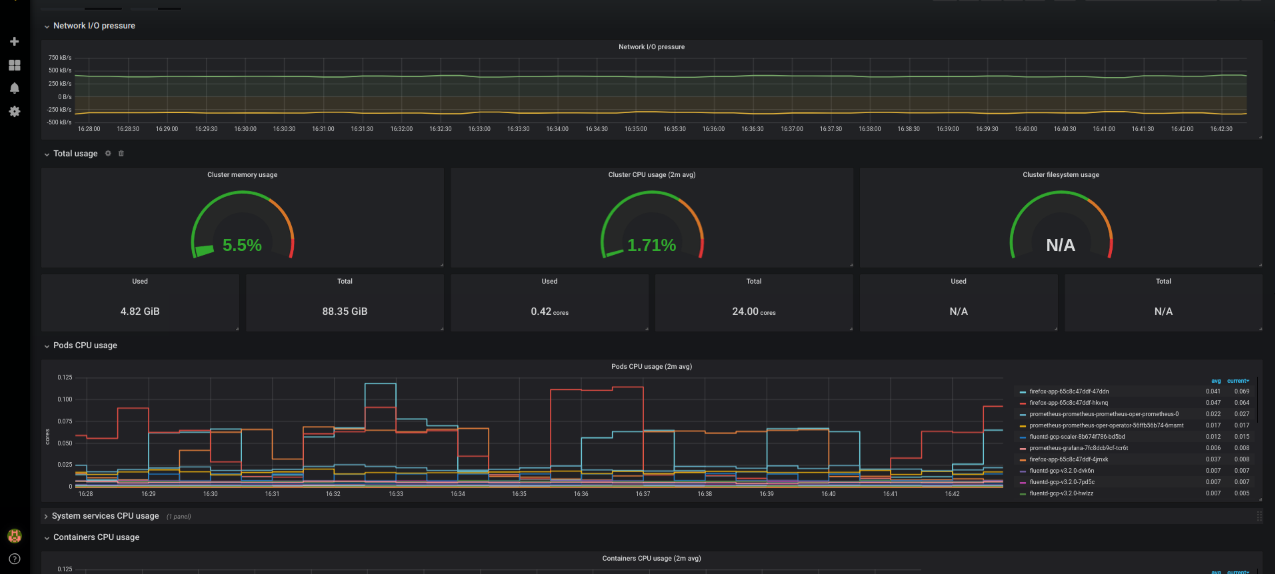
Pods Monitoring Dashboard
For creating a dashboard to monitor all the pods:
- Click '+' button on left panel and select ‘Import’.
- Enter 6417 dashboard id under Grafana.com Dashboard.
- Click ‘Load’.
- Enter Kubernetes Pods Monitoring as the Dashboard name.
- Click change to set the Unique identifier (uid).
- Select ‘Prometheus’ as the endpoint under prometheus data sources drop down.s
- Click ‘Import’.