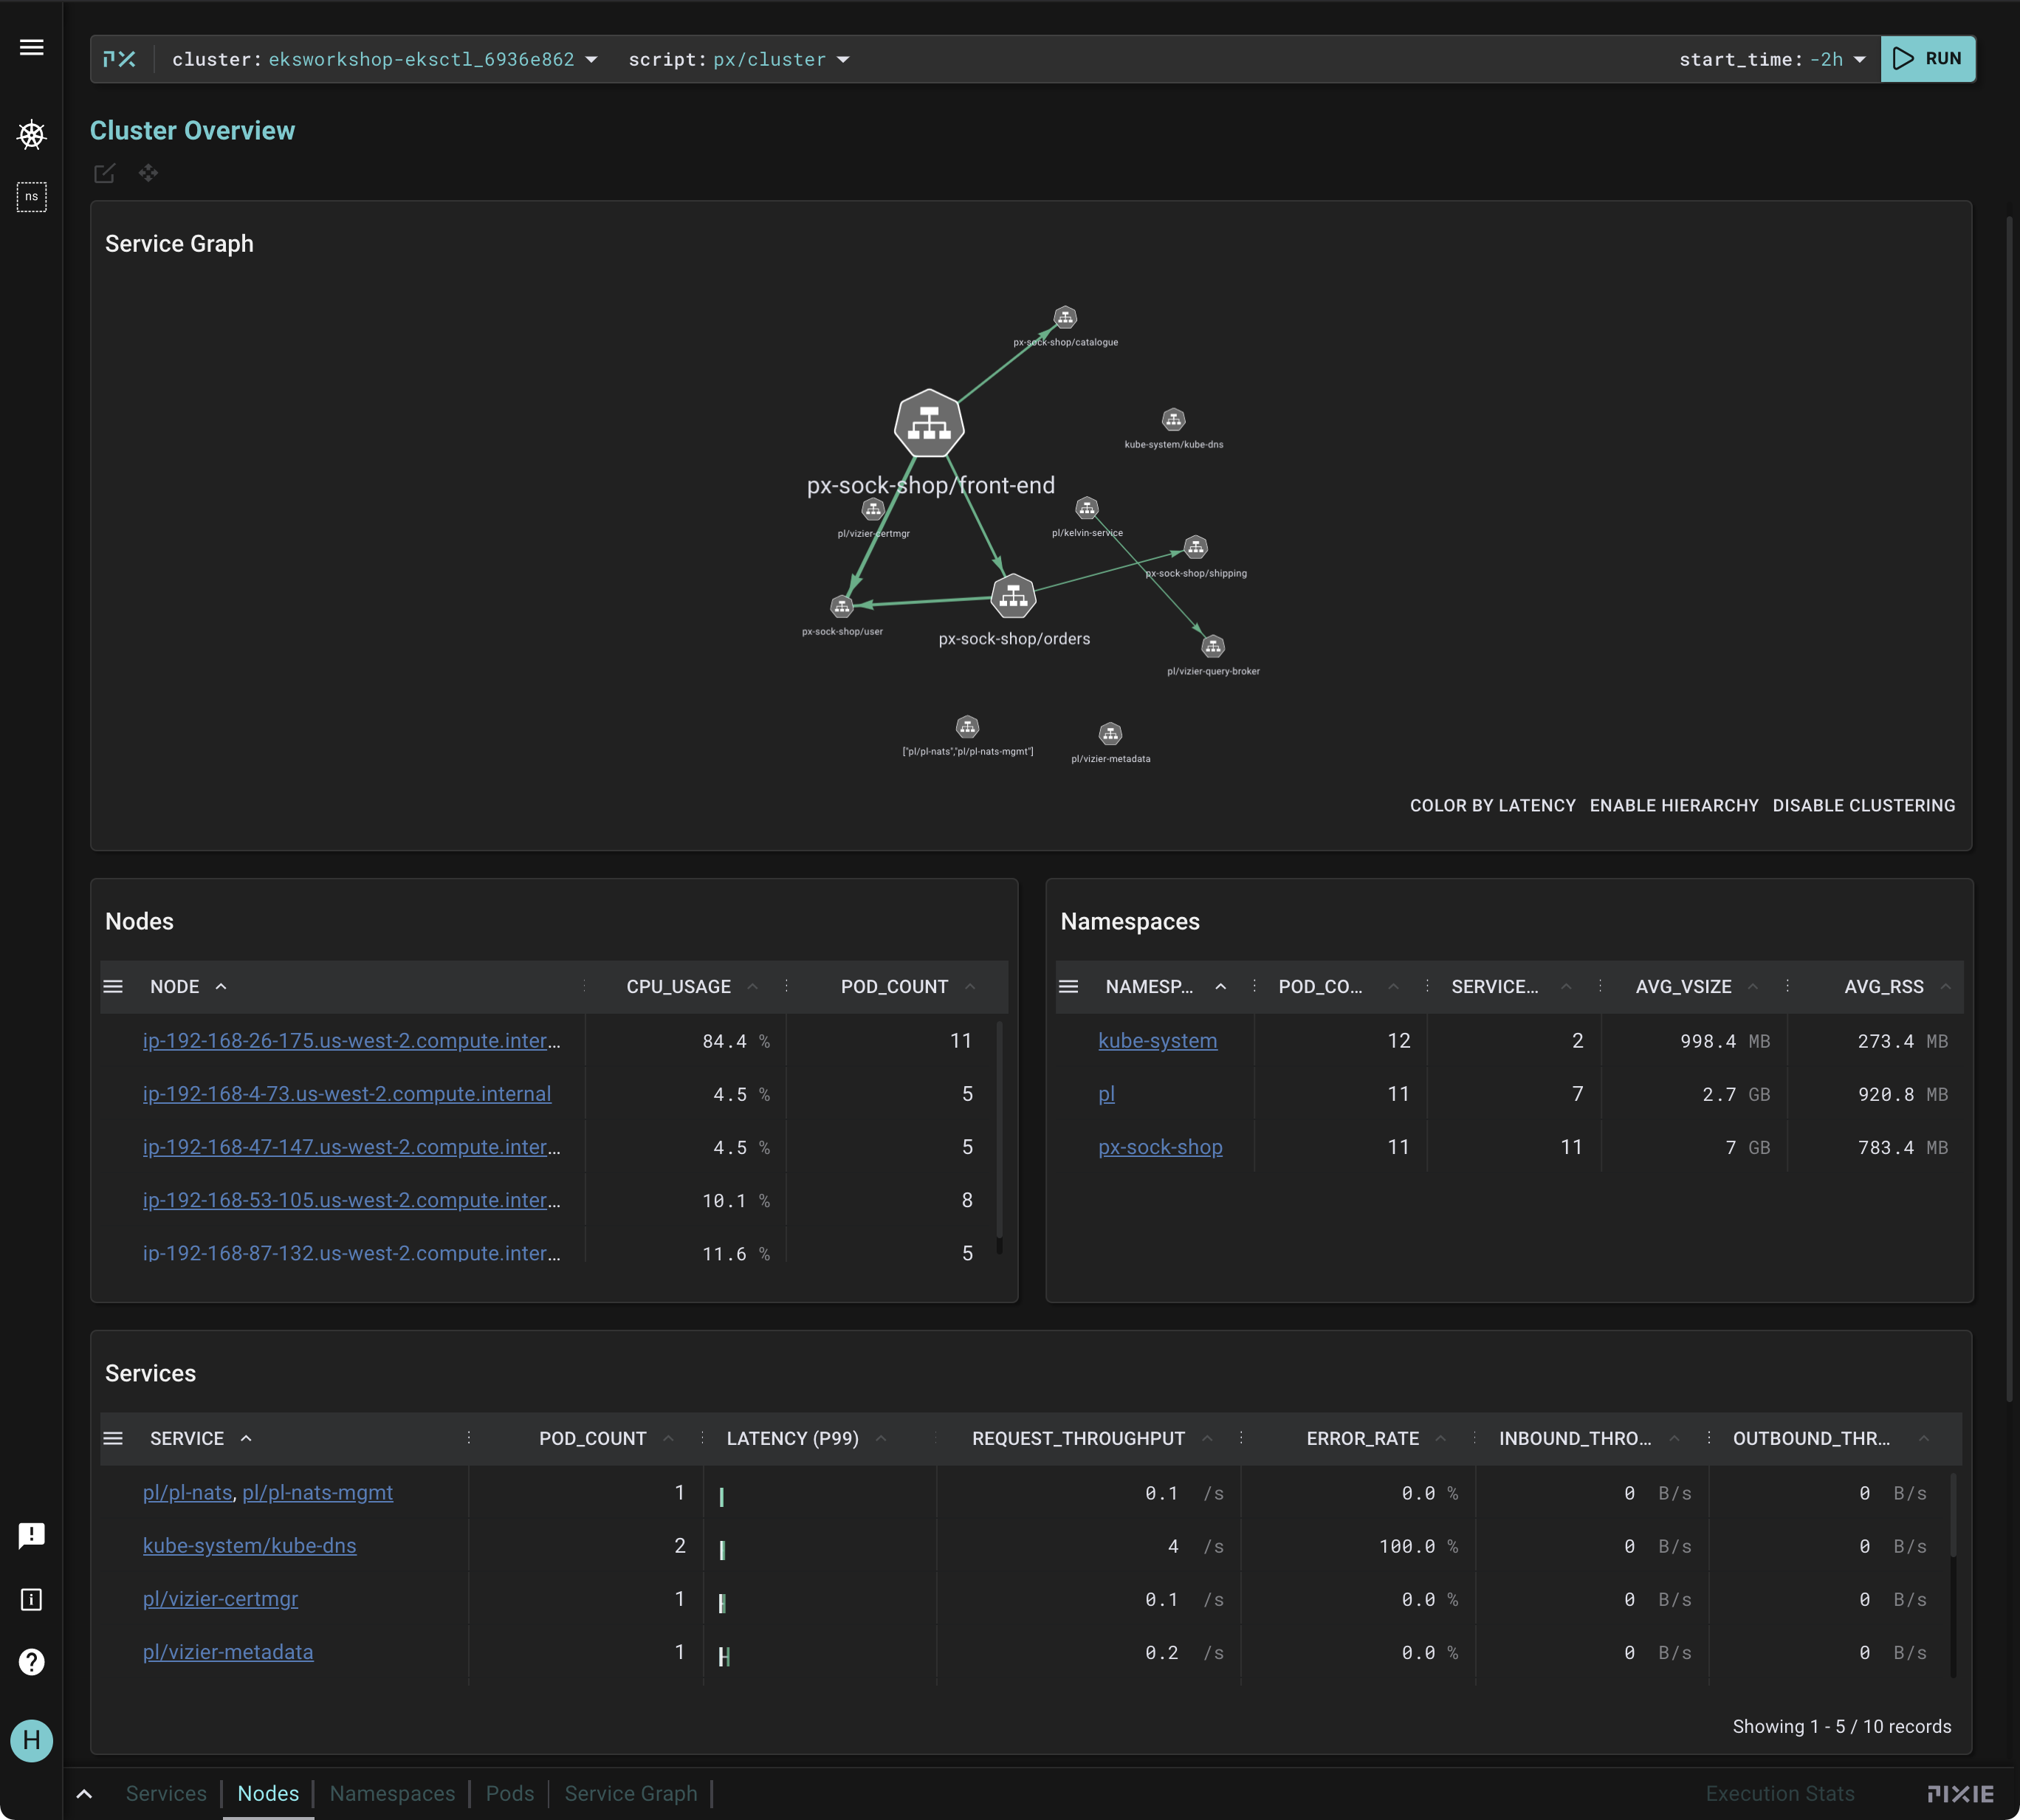
Monitoring using Pixie
In this chapter, we will deploy Pixie to monitor an application on a Kubernetes cluster.

What is Pixie?
Pixie is an open-source observability platform for Kubernetes. It helps developers explore, monitor and debug their applications. Pixie’s features include:
Progressive instrumentation
Pixie collects full-body request traces, system resource metrics, and Kubernetes events right out of box. Pixie’s auto-instrumentation capabilities require no code changes by the user and consume less than 5% overhead, because it powered by eBPF*. Users are also able to augment Pixie’s default instrumentation to collect custom metrics, traces, and logs.
In-cluster edge compute and storage
Pixie performs all data storage and computation entirely within a user’s Kubernetes cluster. This architecture allows the user to isolate data storage and computation within their environment for finer-grained context, faster performance, and a greater level of data security.
Programmatic data access
PxL scripts are the API for querying data in Pixie. Users write PxL scripts to query and analyze their data, making exploration, debugging and analysis more efficient. Pixie’s UI, CLI, and API all accept PxL scripts as their input, so the same script can be reused at any Pixie interface. Pixie ships with a rich set of pre-built PxL scripts contributed by the open source community.
* To learn more about the magic of eBPF, check out Brendan Gregg’s re:Invent 2019 talk covering BPF and its comprehensive usage at Netflix.